Fig. 12.
Download original image
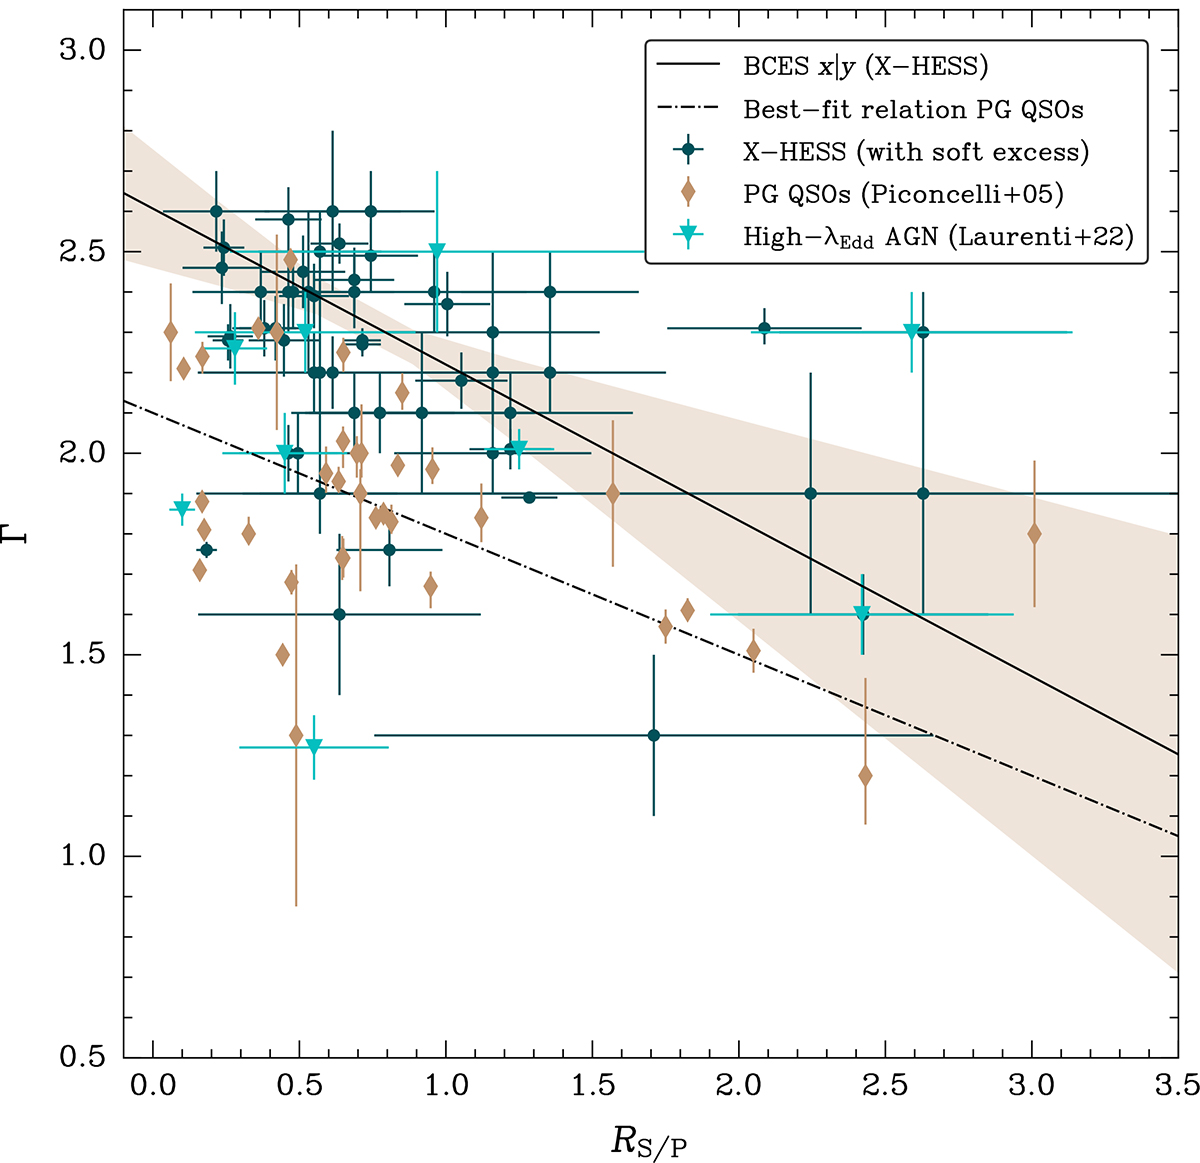
Distribution of the X-HESS AGNs (in green) in the Γ − RS/P plane zoomed in on the region where RS/P ≤ 3.5. The sample of PG QSOs by Piconcelli et al. (2005) and the high-λEdd AGNs studied by Laurenti et al. (2022) are shown in brown and cyan, respectively. The dash-dotted black line indicates the best-fit relation for the PG QSOs. The solid black line describes the BCES x|y best-fit relation derived from the X-HESS AGNs, while the shaded area indicates the 90% confidence band.
Current usage metrics show cumulative count of Article Views (full-text article views including HTML views, PDF and ePub downloads, according to the available data) and Abstracts Views on Vision4Press platform.
Data correspond to usage on the plateform after 2015. The current usage metrics is available 48-96 hours after online publication and is updated daily on week days.
Initial download of the metrics may take a while.