Fig. 6.
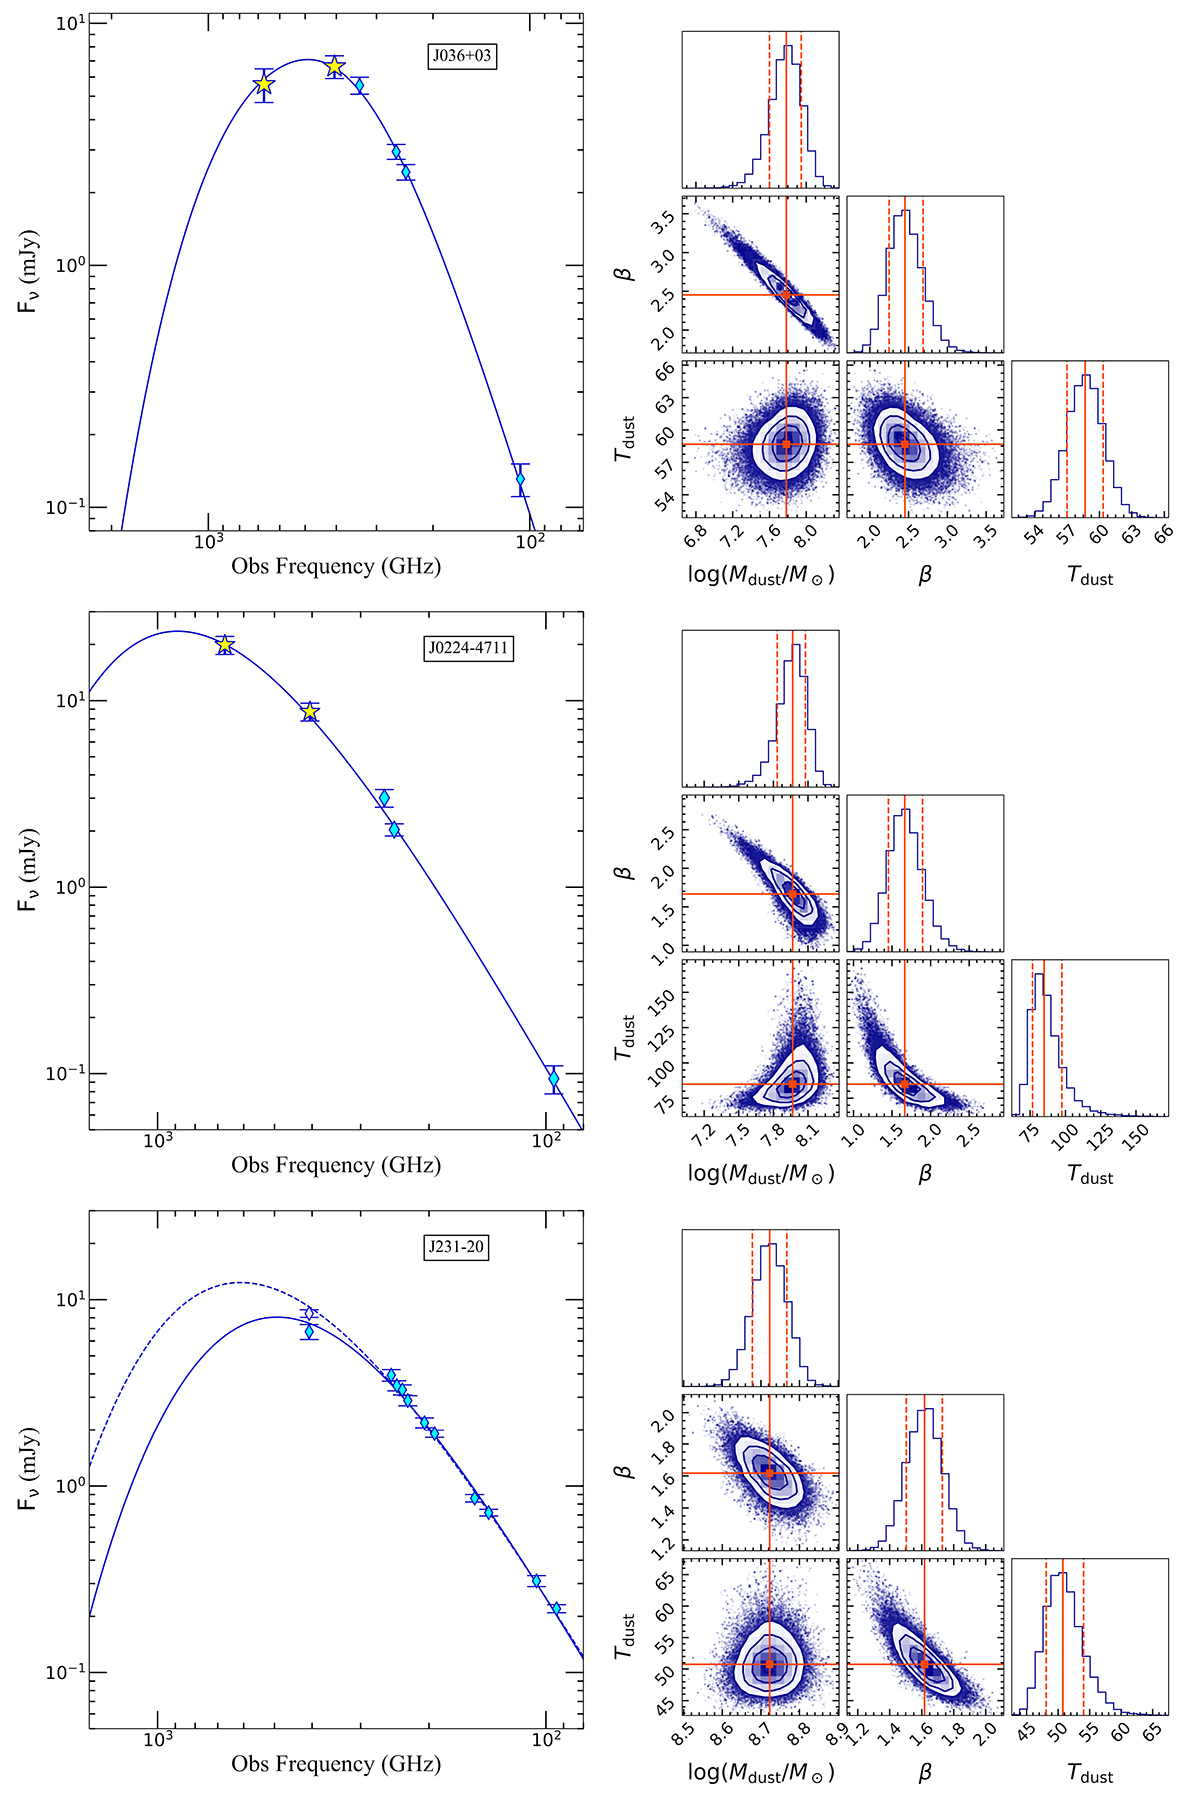
Download original image
Observed SEDs and best-fitting results. Left panels: Observed SEDs of QSOs J036+03, J0224-4711, and J231−20 (top, central, and bottom row). Our new ALMA B8 and B9 data are shown as yellow stars, and other archival observations are plotted as cyan diamonds. The best-fitting curve is shown as the solid blue line. Right panels: Corner plot showing the posterior probability distributions of Tdust, Mdust, and β. The solid orange lines indicate the best-fitting value for each parameter, and the dashed lines mark the 16th and 84th percentiles for each parameter. For J231−20, the empty diamond is the flux in B8, not corrected for the presence of the companion, and the dashed line is the best-fitting SED considering this flux (for details, see Sect. 5.1).
Current usage metrics show cumulative count of Article Views (full-text article views including HTML views, PDF and ePub downloads, according to the available data) and Abstracts Views on Vision4Press platform.
Data correspond to usage on the plateform after 2015. The current usage metrics is available 48-96 hours after online publication and is updated daily on week days.
Initial download of the metrics may take a while.