Fig. 4.
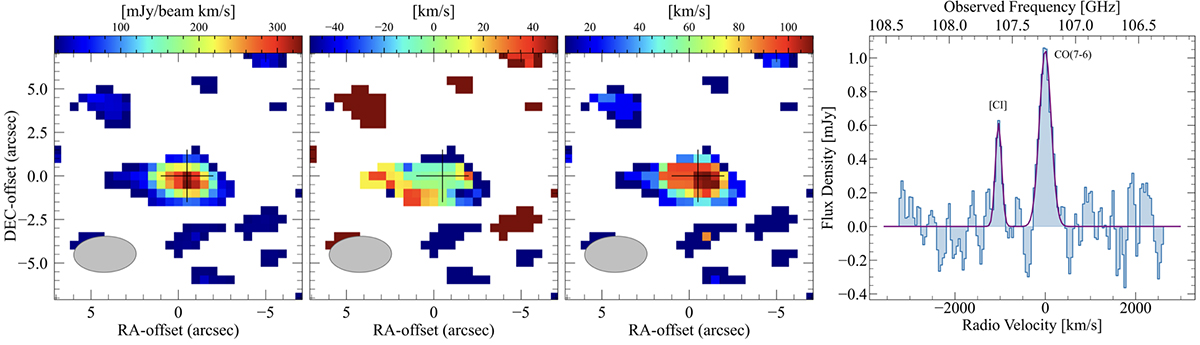
Download original image
Moment maps of the CO(7−6) emission line and spectrum of CO(7−6) and [CI] emission lines of J0224−4711. From left to right: Integrated flux, mean velocity map, velocity dispersion map, and continuum-subtracted spectra of CO(7−6) and [CI]. The clean beam is plotted in the lower left corner of the moment maps. The cross indicates the peak position of the Band 3 continuum emission. The spectrum was extracted from the region included within ≥2σ in the CO(7−6) map.
Current usage metrics show cumulative count of Article Views (full-text article views including HTML views, PDF and ePub downloads, according to the available data) and Abstracts Views on Vision4Press platform.
Data correspond to usage on the plateform after 2015. The current usage metrics is available 48-96 hours after online publication and is updated daily on week days.
Initial download of the metrics may take a while.