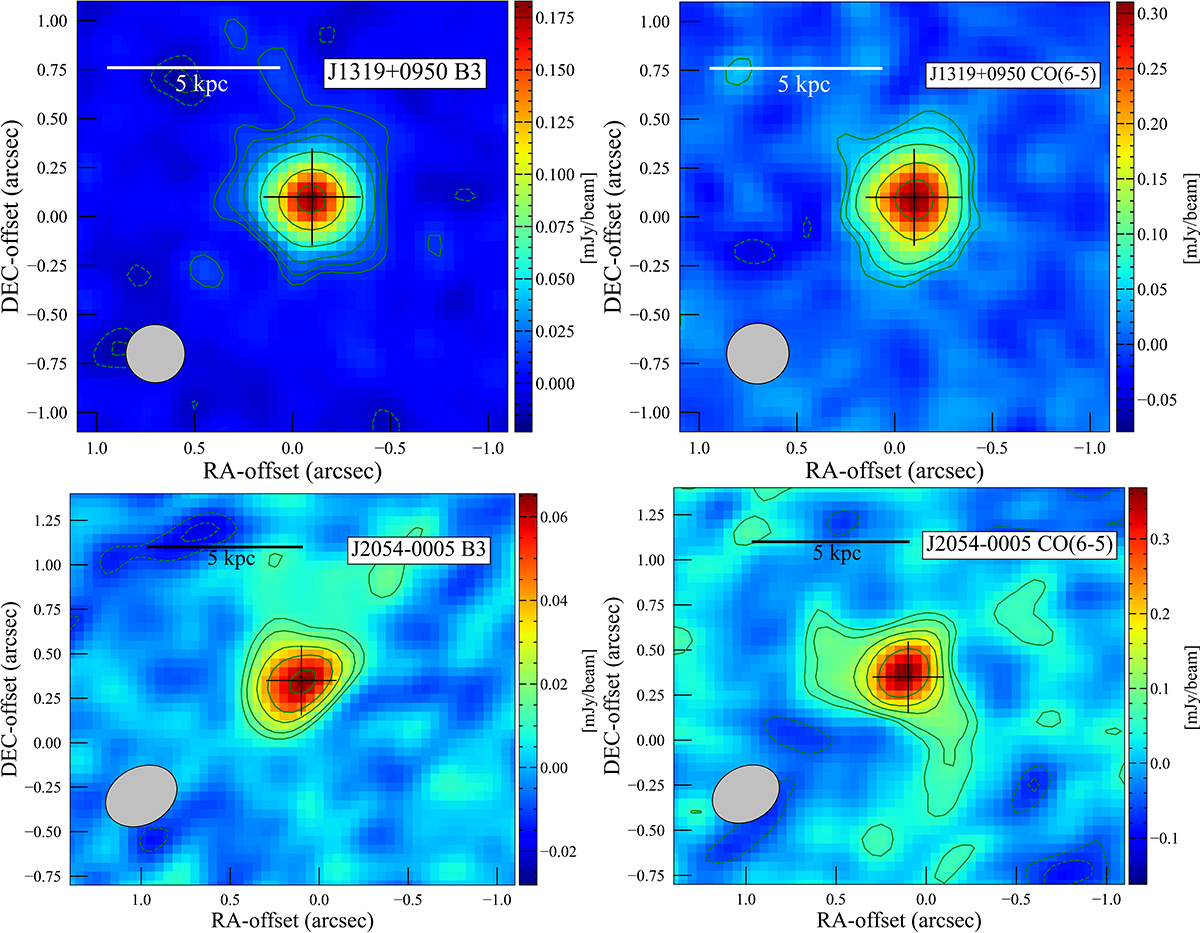
Fig. 2.
Download original image
Dust continuum and CO(6−5) emission line maps of QSOs J1319+0950 and J2054−0005. Top left panel: 103 GHz dust continuum map of QSO J1319+0950 (levels −3, −2, 2, 3, 5, 10, and 20σ, σ = 0.005 mJy/beam). The clean beam (0.30 × 0.30 arcsec2, PA = −78.56°) is indicated in the lower left corner of the diagram. Top right panel: CO(6−5) map of QSO J1319+0950 (levels −3, −2, 2, 3, 5, 10, and 15σ, σ = 0.017 mJy/beam). The clean beam (0.32 × 0.31 arcsec2, PA = −78.56°) is indicated in the lower left corner of the diagram. Bottom left panel: 92 GHz dust continuum map of QSO J2054−0005 (levels −3, −2, 2, 3, 5, 7 and 10σ, σ = 0.006 mJy/beam). The clean beam (0.42 × 0.32 arcsec2, PA = −61.3°) is indicated in the lower left corner of the diagram. Bottom right panel: CO(6−5) map of QSO J2054−0005 (levels −3, −2, 2, 3, 5, 7 and 10σ, σ = 0.025 mJy/beam). The clean beam (0.39 × 0.30 arcsec2, PA = −61.4°) is indicated in the lower left corner of the diagram. The cross indicates the position of the continuum peak for each source.
Current usage metrics show cumulative count of Article Views (full-text article views including HTML views, PDF and ePub downloads, according to the available data) and Abstracts Views on Vision4Press platform.
Data correspond to usage on the plateform after 2015. The current usage metrics is available 48-96 hours after online publication and is updated daily on week days.
Initial download of the metrics may take a while.