Fig. 17.
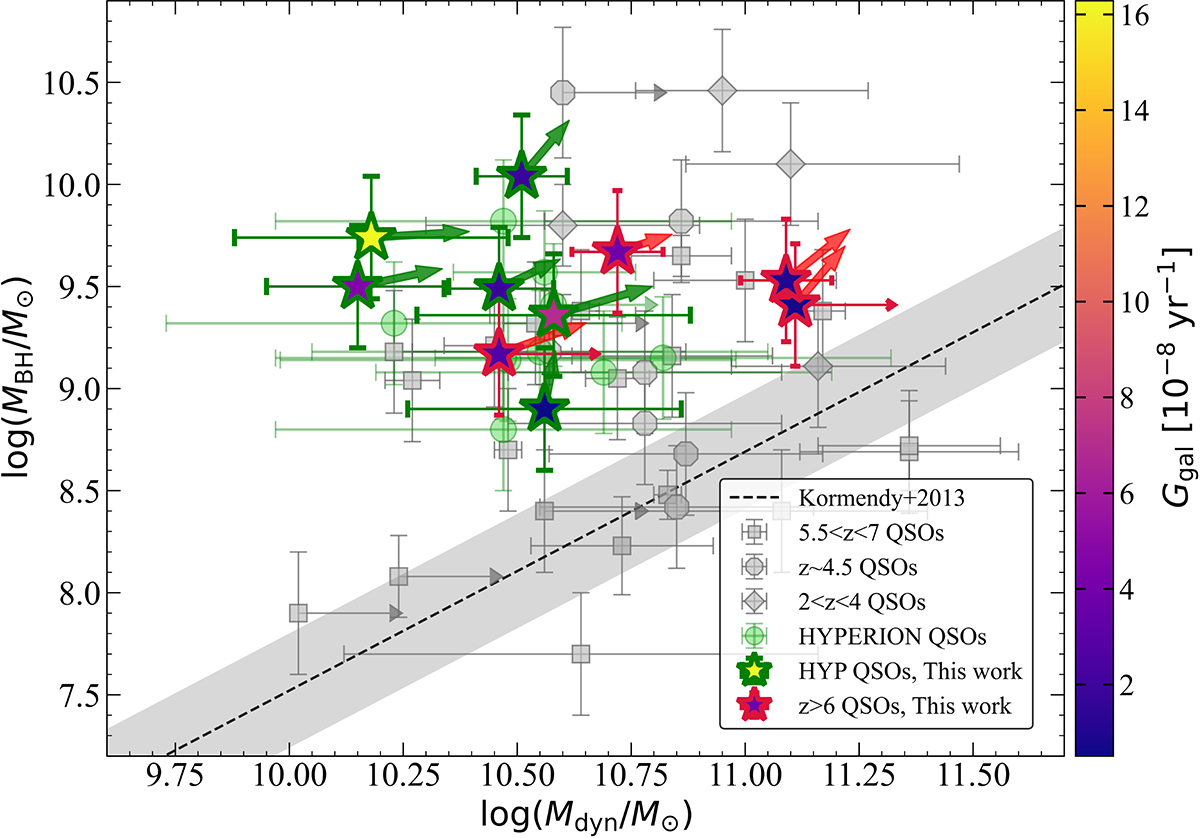
Download original image
BH mass vs. dynamical mass for our sample (stars with green contours for HYPERION QSOs, and red contours otherwise), WISSH QSOs at z ∼ 2 − 4 (gray diamonds; Bischetti et al. 2021), and luminous z ∼ 4 − 7 QSOs (gray dots and gray squares; Venemans et al. 2016, 2017; Willott et al. 2013, 2015, 2017; Kimball et al. 2015; Trakhtenbrot et al. 2017; Feruglio et al. 2018; Mortlock et al. 2011; De Rosa et al. 2014; Kashikawa et al. 2015; Neeleman et al. 2021). The dashed black line (and shaded area) is the local relation from Kormendy & Ho (2013). The light green dots are the remaining HYPERION QSOs for which we were not yet able to perform a detailed study of the dust properties due to a lack of observations in the submm regime. The stars are color-coded based on the value of Ggal. The thin red arrows indicate upper limits on the dynamical mass.
Current usage metrics show cumulative count of Article Views (full-text article views including HTML views, PDF and ePub downloads, according to the available data) and Abstracts Views on Vision4Press platform.
Data correspond to usage on the plateform after 2015. The current usage metrics is available 48-96 hours after online publication and is updated daily on week days.
Initial download of the metrics may take a while.