Fig. 16.
Download original image
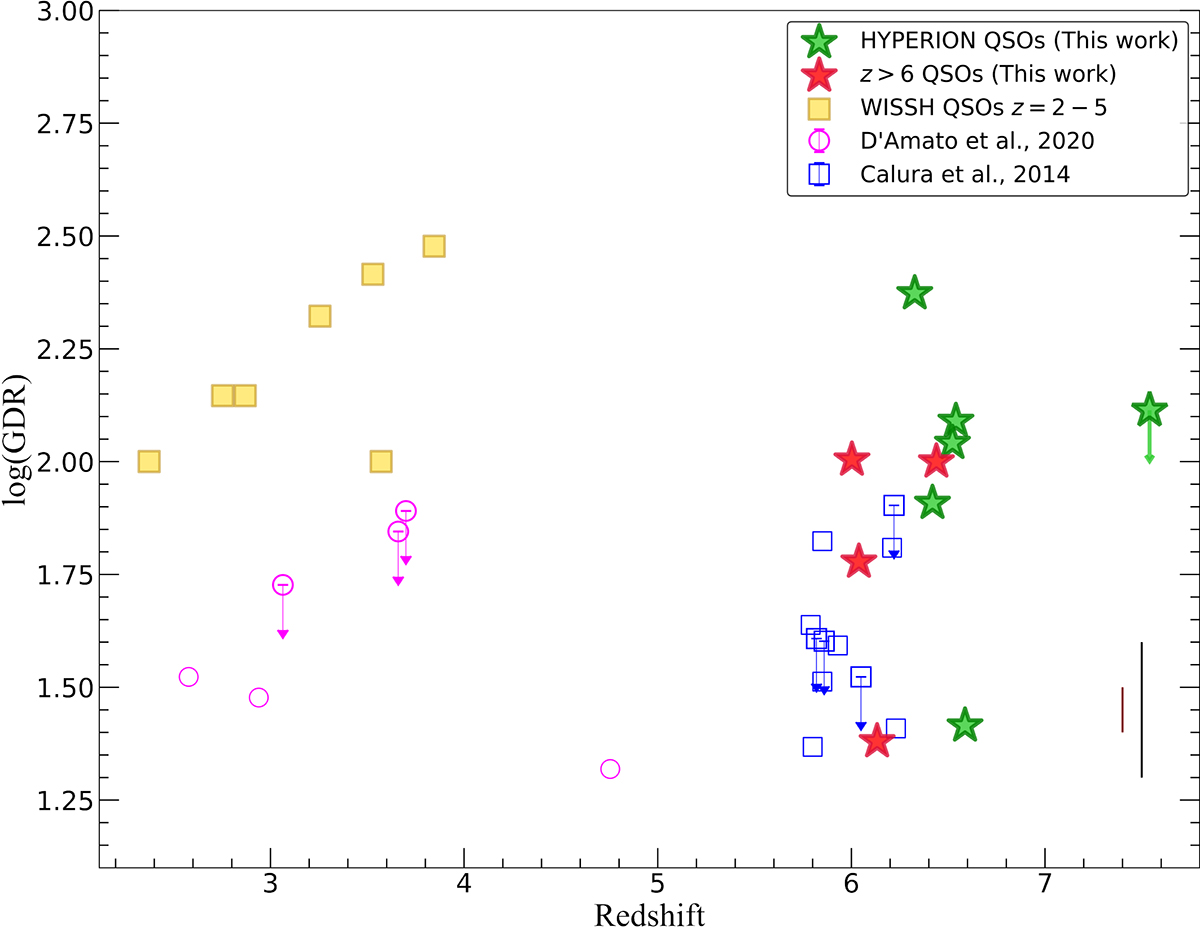
Redshift distribution of the GDR. The symbols and colors for the WISSH and our sample are the same as in Fig. 12. We compare our results with the WISSH sample (Bischetti et al. 2021), a sample of 2 < z < 5 star-forming galaxies hosting a heavily obscured AGN in the Chandra Deep Field-South (magenta dots, D’Amato et al. 2020), and a sample of z > 5.5 QSOs (blue squares Calura et al. 2014). The two vertical lines at the bottom right side are the systematic uncertainties induced by the choice of αCO and dust mass estimation (black line, ∼0.3 dex) and r65 or r76 in computing the gas mass (brown line, ∼0.1 dex).
Current usage metrics show cumulative count of Article Views (full-text article views including HTML views, PDF and ePub downloads, according to the available data) and Abstracts Views on Vision4Press platform.
Data correspond to usage on the plateform after 2015. The current usage metrics is available 48-96 hours after online publication and is updated daily on week days.
Initial download of the metrics may take a while.