Fig. 15.
Download original image
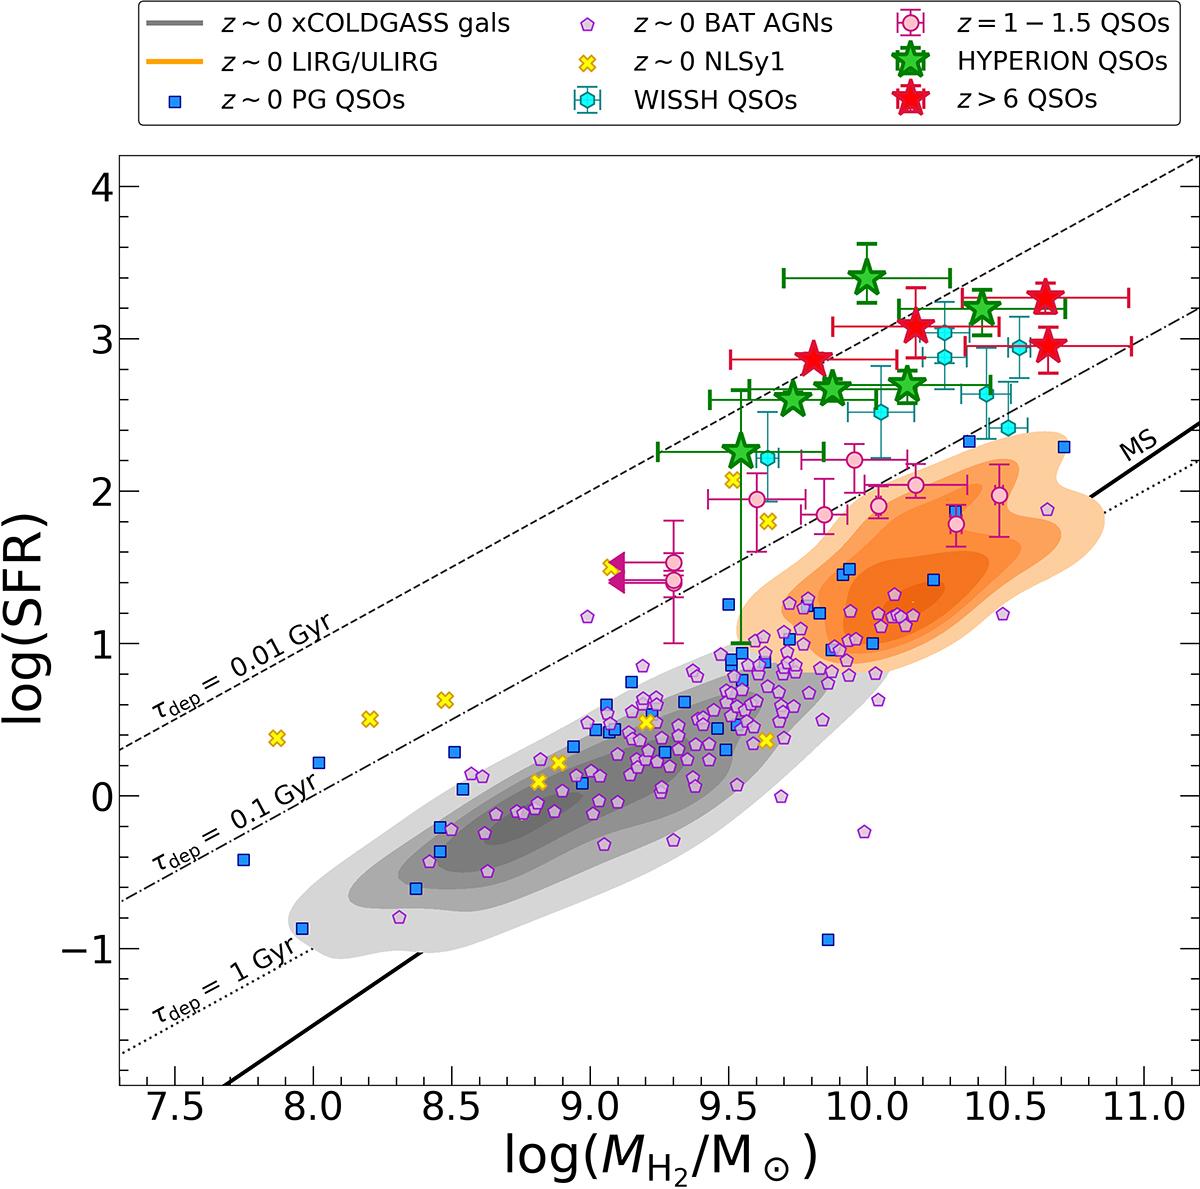
SFR as a function of the molecular gas mass, MH2. The symbols for our sample are the same as in Fig. 12. We compare our results with the WISSH sample (Bischetti et al. 2021), with 1 < z < 1.5 QSOs (pink dots), and with z ∼ 0 sources such as galaxies, ULIRGs, QSOs, AGNs, and narrow-line Seyfert 1 galaxies (symbols and colors in the legend; Saintonge et al. 2011, 2017; Salomé et al. 2023; Shangguan et al. 2020a,b; Rosario et al. 2018; Koss et al. 2021). The gray lines represent fixed values of the gas depletion time (i.e., the inverse of SFE), which is reported at the top of the line. The solid black line is the galaxy main sequence derived by Sargent et al. (2014) considering massive galaxies (M* > 1010 M⊙) up to z ∼ 2.
Current usage metrics show cumulative count of Article Views (full-text article views including HTML views, PDF and ePub downloads, according to the available data) and Abstracts Views on Vision4Press platform.
Data correspond to usage on the plateform after 2015. The current usage metrics is available 48-96 hours after online publication and is updated daily on week days.
Initial download of the metrics may take a while.