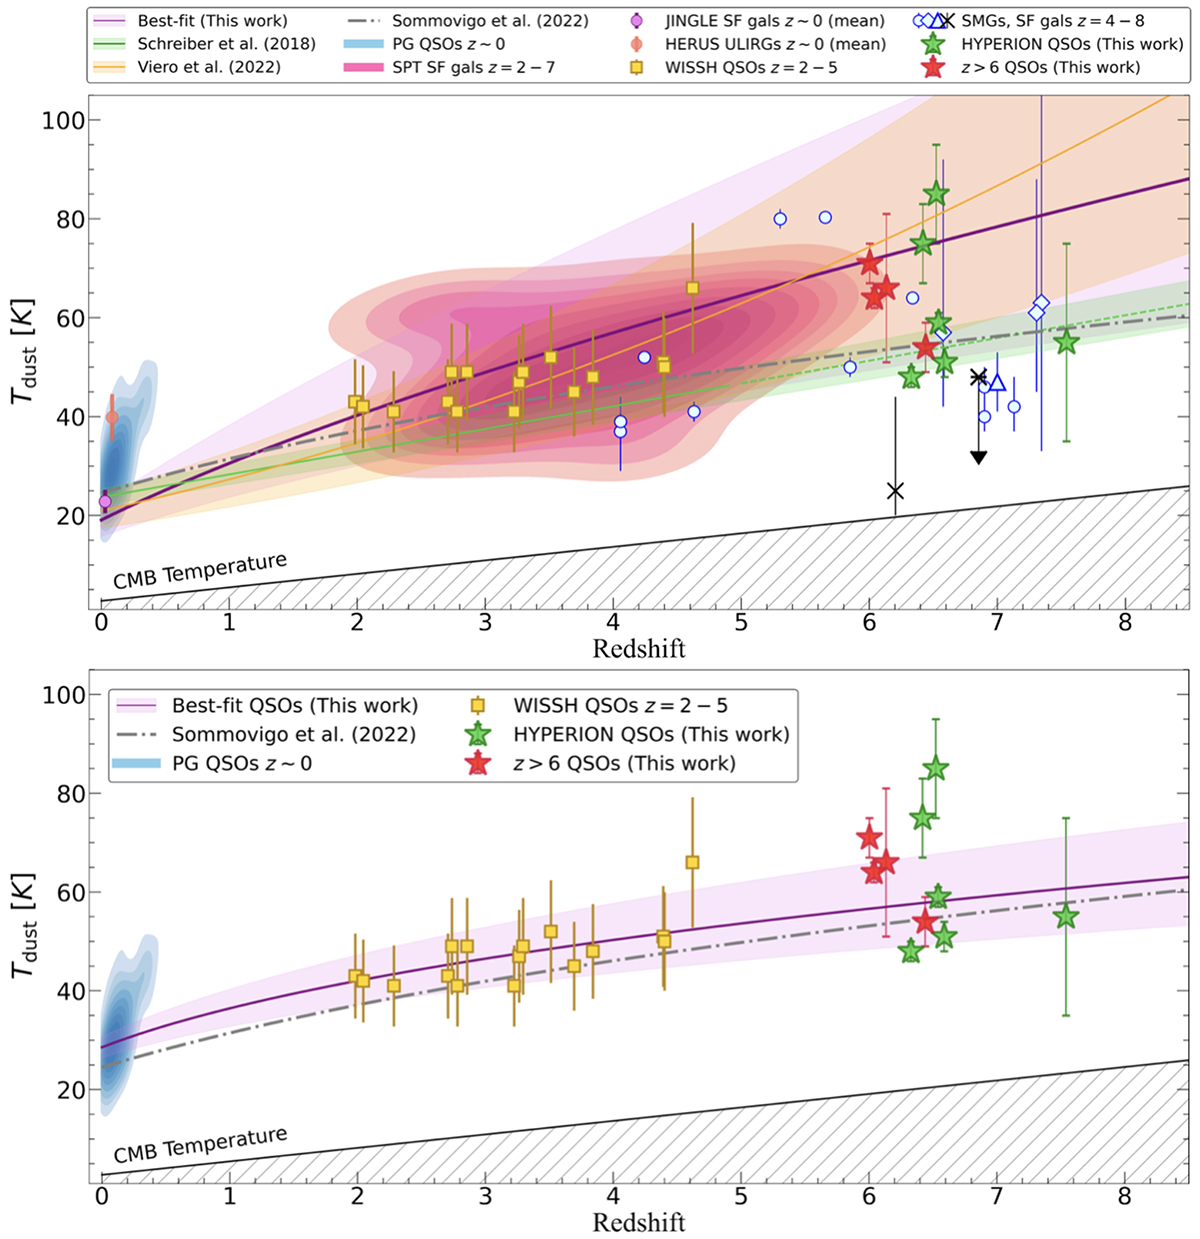
Fig. 12.
Download original image
Dust temperature as a function of redshift. Our sample is shown as stars (red for Hyperion QSOs, green otherwise). Top panel: Comparison of our results with samples of local QSOs (PG, blue colormap with contours, Petric et al. 2015), local star-forming galaxies (JINGLE, mean value as pink dot, Lamperti et al. 2019), local ULIRGs (HERUS, mean value as orange dot, Clements et al. 2018), 2 < z < 7 star-forming galaxies (SPT, pink colormap with contours Reuter et al. 2020), 2 < z < 5 QSOs (WISSH, yellow squares, Duras et al. 2017), 4 < z < 7.5 SMGs and star-forming galaxies (light blue dots, Witstok et al. 2023), three z > 6.7 REBELS galaxies (light blue diamonds, Algera et al. 2023), an average-REBELS galaxy (light blue triangle, Sommovigo et al. 2022), and two galaxies with very low dust temperatures at z > 6 (black crosses, Witstok et al. 2022; Harikane et al. 2020). The observed trends inferred by Viero et al. (2022) and Schreiber et al. (2018) are shown as an orange and green lines and shaded regions, respectively. Our best-fitting curve is shown as a purple line with a shaded region. The theoretical relation found in Sommovigo et al. (2022) is shown as a dashed gray line. The solid black line marks the CMB temperature level. Bottom panel: Focus on the comparison to the samples of local PG QSOs (blue color map with contours) and 2 < z < 5 WISSH QSOs. Our best-fitting curve considering QSOs alone is shown as a purple line with a shaded region.
Current usage metrics show cumulative count of Article Views (full-text article views including HTML views, PDF and ePub downloads, according to the available data) and Abstracts Views on Vision4Press platform.
Data correspond to usage on the plateform after 2015. The current usage metrics is available 48-96 hours after online publication and is updated daily on week days.
Initial download of the metrics may take a while.