Fig. 11.
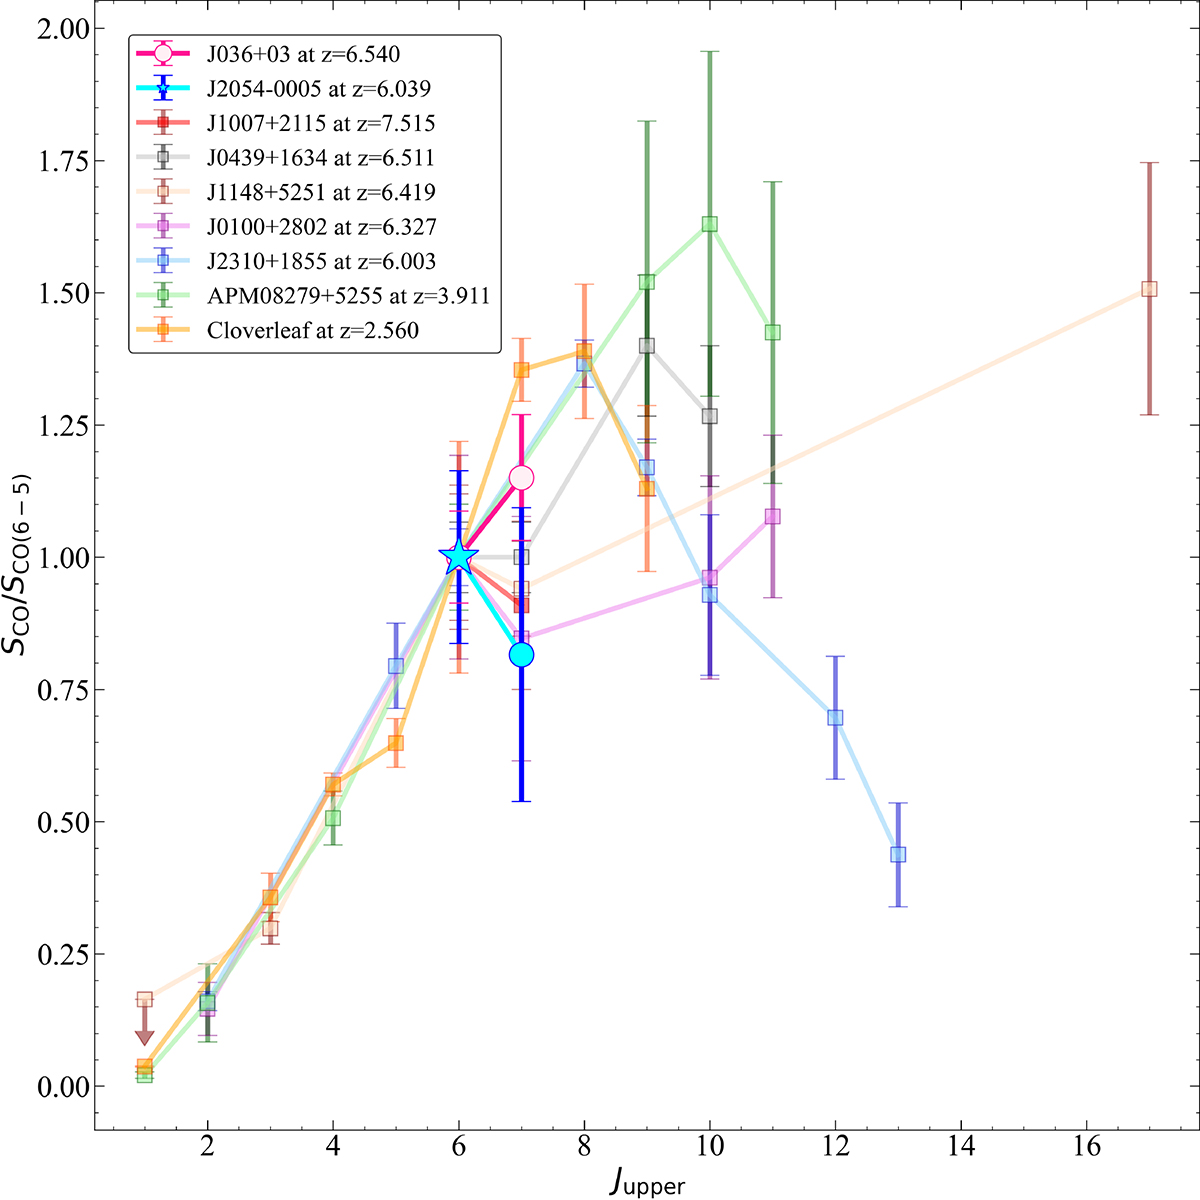
Download original image
CO SLED of J036+03 and J2054−0005 compared with those of other QSOs at z > 6 and at lower redshift. The CO SLEDs for J036+03 and J2054−0005 are shown as pink circles and cyan markers, respectively. For J2054−0005, the star refers to the CO(6−5) line studied in this work and the circle to the CO(7−6) in Decarli et al. (2022). The results for J036+03 are taken from Decarli et al. (2022). All other sources are displayed as shadowed squares: J1007+2115 at z = 7.5419 in red (Feruglio et al. 2023); J0439+1634 at z = 6.511 in gray (Yang et al. 2019); J1148+5251 at z = 6.419 in brown (Riechers et al. 2009; Gallerani et al. 2014); J0100+2802 at z = 6.327 in purple (Wang et al. 2019b); J2310+1855 at z = 6.003 in blue (Li et al. 2020); APM08279+5255 at z = 3.911 in green (Papadopoulos et al. 2001; Weiß et al. 2007); and Cloverleaf at z = 2.560 in orange (Bradford et al. 2009; Uzgil et al. 2016).
Current usage metrics show cumulative count of Article Views (full-text article views including HTML views, PDF and ePub downloads, according to the available data) and Abstracts Views on Vision4Press platform.
Data correspond to usage on the plateform after 2015. The current usage metrics is available 48-96 hours after online publication and is updated daily on week days.
Initial download of the metrics may take a while.