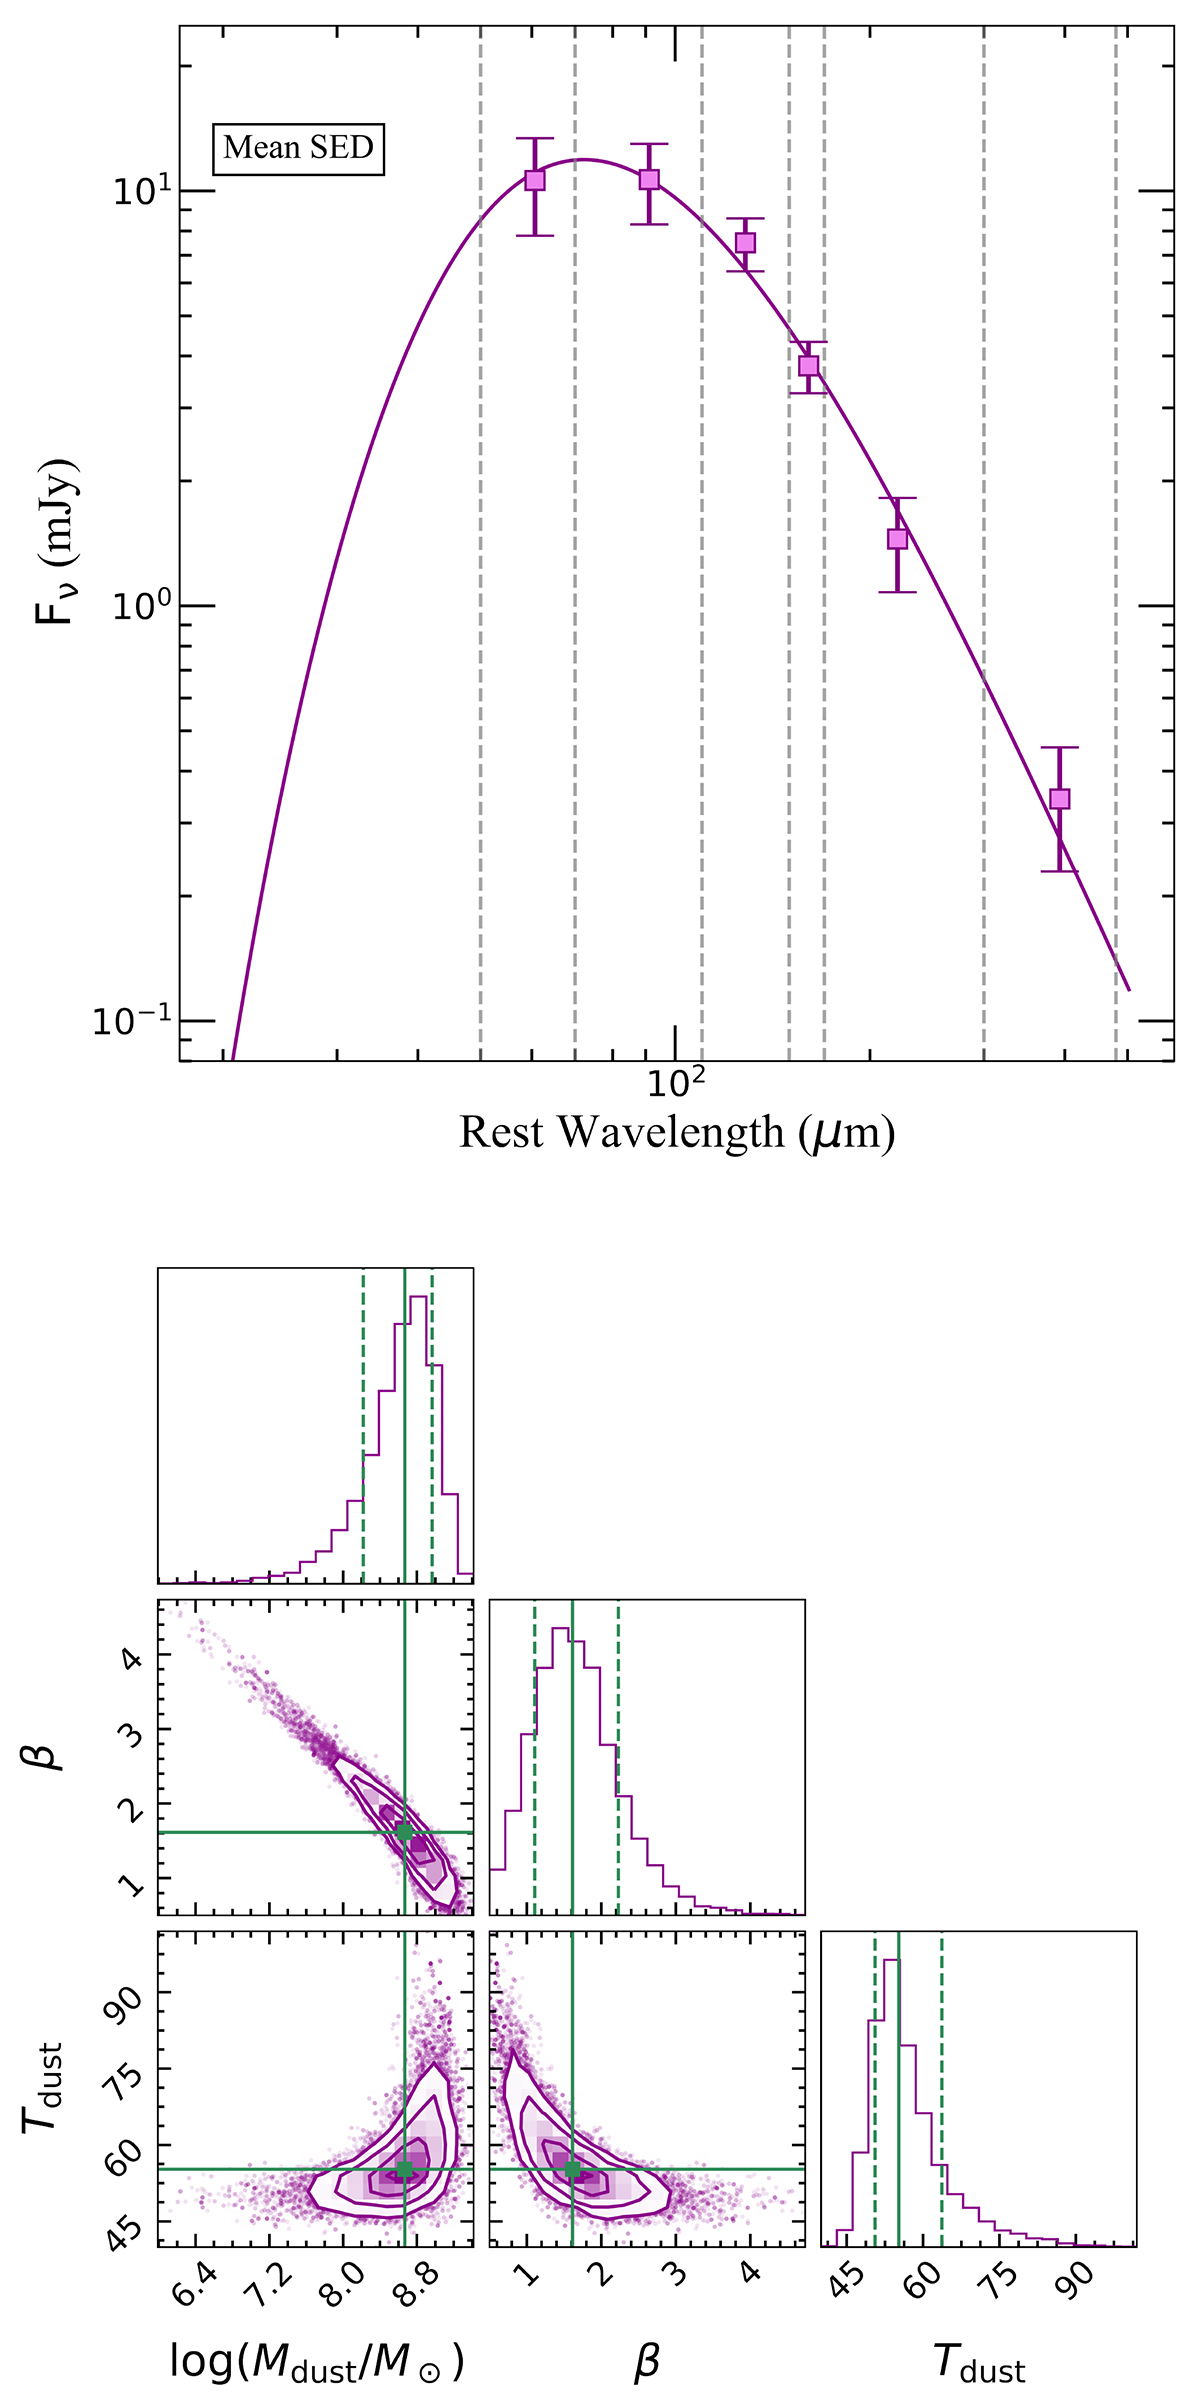
Fig. 10.
Download original image
Results for the observed mean cold-dust SED. Left panel: Observed mean fluxes and best-fitting function. The dashed gray lines mark the six bins we used to develop the mean SED. Right panel: Corner plot showing the posterior probability distributions of Tdust, Mdust, and β. The solid green lines indicate the best-fitting value for each parameter, while the dashed lines mark the 16th and 84th percentiles for each parameter.
Current usage metrics show cumulative count of Article Views (full-text article views including HTML views, PDF and ePub downloads, according to the available data) and Abstracts Views on Vision4Press platform.
Data correspond to usage on the plateform after 2015. The current usage metrics is available 48-96 hours after online publication and is updated daily on week days.
Initial download of the metrics may take a while.