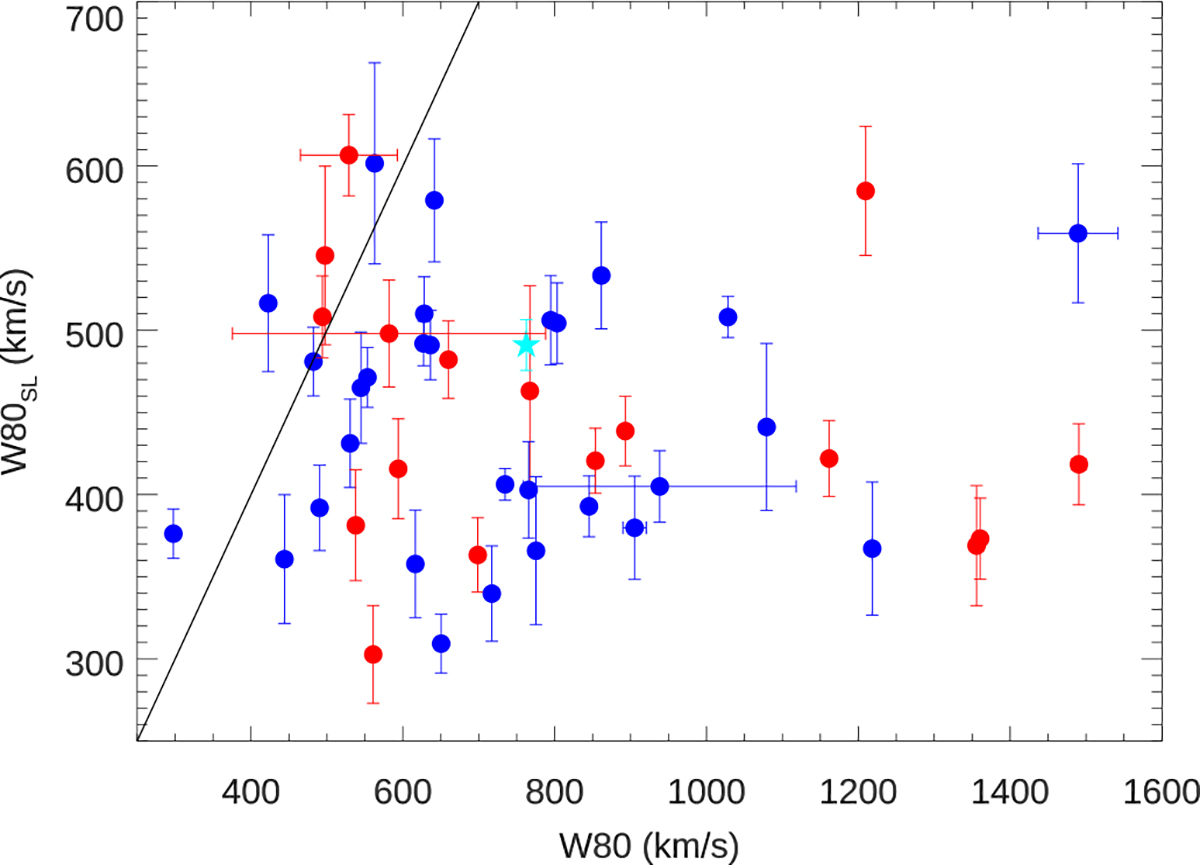
Fig. 9.
Download original image
Results of the non-parametric [OIII] line measurements compared to the velocity dispersion of the stellar component of the host galaxies measured by STARLIGHT. The black line shows the one-to-one relation between the two values. Note that for presentation purposes, J1347+12 has been omitted from this plot due to it’s high value of W80 (≈2520 km s−1).
Current usage metrics show cumulative count of Article Views (full-text article views including HTML views, PDF and ePub downloads, according to the available data) and Abstracts Views on Vision4Press platform.
Data correspond to usage on the plateform after 2015. The current usage metrics is available 48-96 hours after online publication and is updated daily on week days.
Initial download of the metrics may take a while.