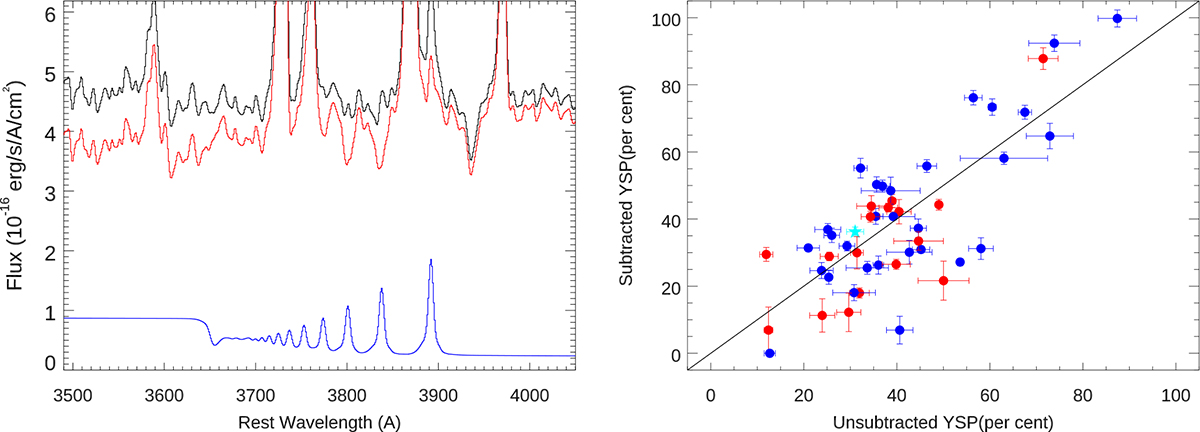
Fig. 8.
Download original image
Example of the impact of the nebular subtraction process on the SDSS spectrum of J1316+44 (left). The black and red lines show the original and nebular subtracted data, while the blue line shows the subtracted nebular model. A comparison of the percentage of the total flux allocated to the YSP in the unsubtracted and nebular subtracted data is shown on the right. The black line shows the one-to-one relation between the two values. Red and blue points represent objects classified as morphologically undisturbed and disturbed, respectively.
Current usage metrics show cumulative count of Article Views (full-text article views including HTML views, PDF and ePub downloads, according to the available data) and Abstracts Views on Vision4Press platform.
Data correspond to usage on the plateform after 2015. The current usage metrics is available 48-96 hours after online publication and is updated daily on week days.
Initial download of the metrics may take a while.