Fig. 7.
Download original image
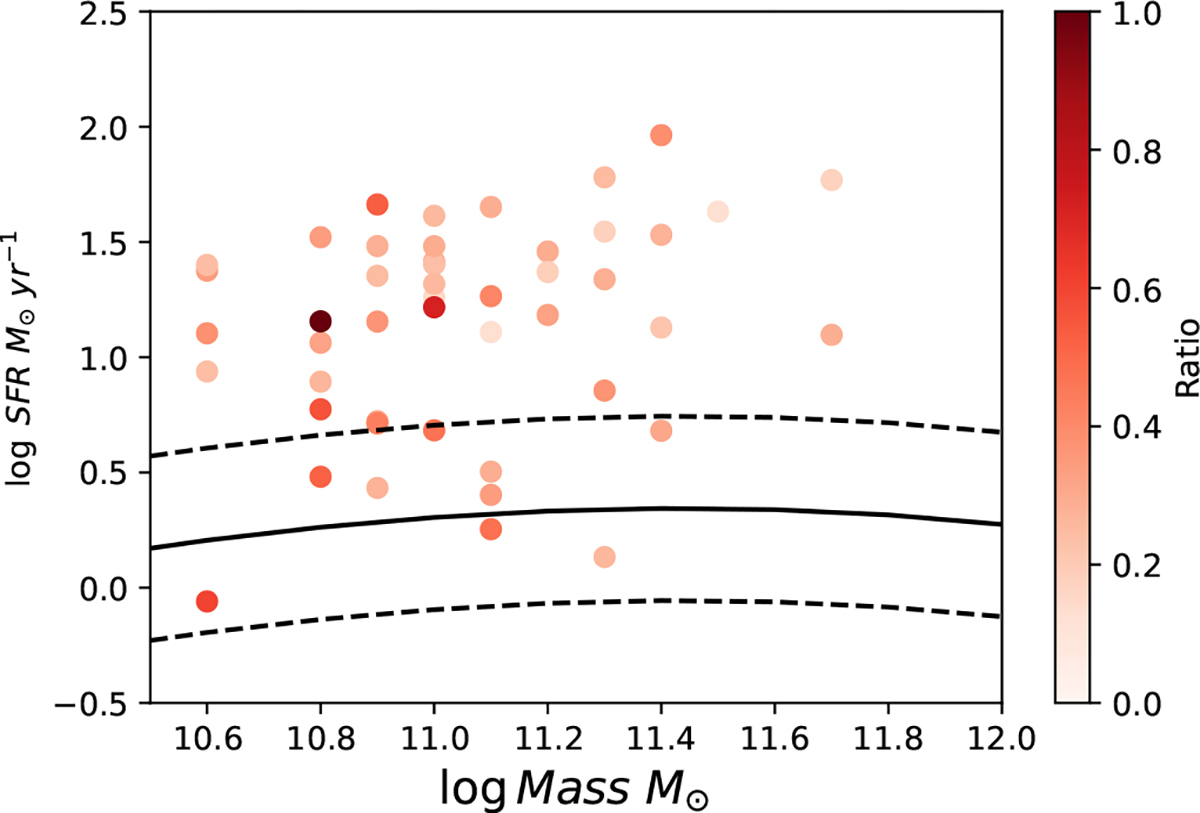
SFR measured from the STARLIGHT modelling of the SDSS spectra against the total stellar mass of the host galaxies (Pierce et al. 2023). The colour scale shows the ratio of the physical size on the galaxy covered by the SDSS fibre against the r-band Petrosian diameter. The black solid line shows the SF main sequence (MS) defined in Saintonge et al. (2016) and the dashed black lines the range of SFR that is considered to cover the MS (±0.4 dex).
Current usage metrics show cumulative count of Article Views (full-text article views including HTML views, PDF and ePub downloads, according to the available data) and Abstracts Views on Vision4Press platform.
Data correspond to usage on the plateform after 2015. The current usage metrics is available 48-96 hours after online publication and is updated daily on week days.
Initial download of the metrics may take a while.