Fig. 5.
Download original image
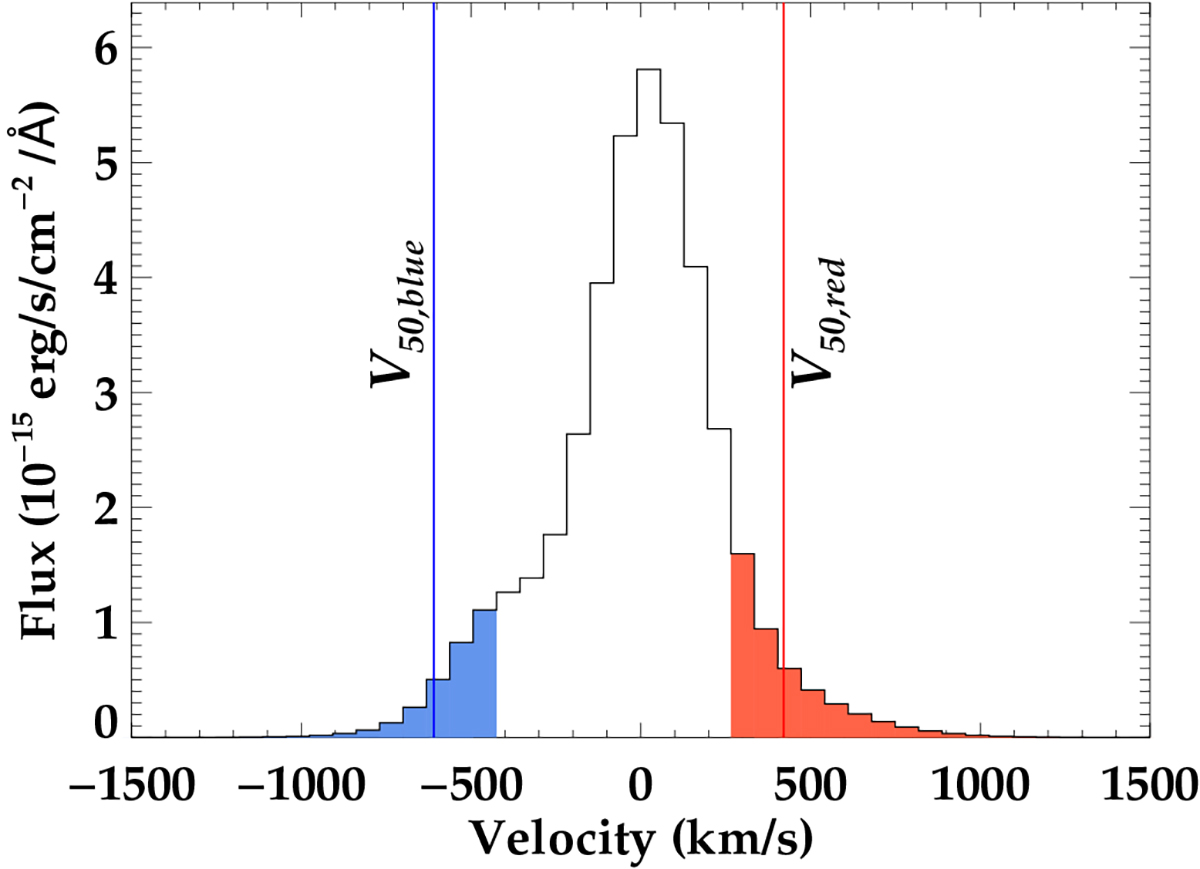
Example of how outflow fluxes and velocities were calculated. The black line shows the model of the [OIII]λ5007 emission line and the blue and red shaded regions show the velocities at which gas is considered to be included in the outflow. The solid blue and red lines represent v50, blue and v50, red which are the outflow velocities.
Current usage metrics show cumulative count of Article Views (full-text article views including HTML views, PDF and ePub downloads, according to the available data) and Abstracts Views on Vision4Press platform.
Data correspond to usage on the plateform after 2015. The current usage metrics is available 48-96 hours after online publication and is updated daily on week days.
Initial download of the metrics may take a while.