Fig. 4.
Download original image
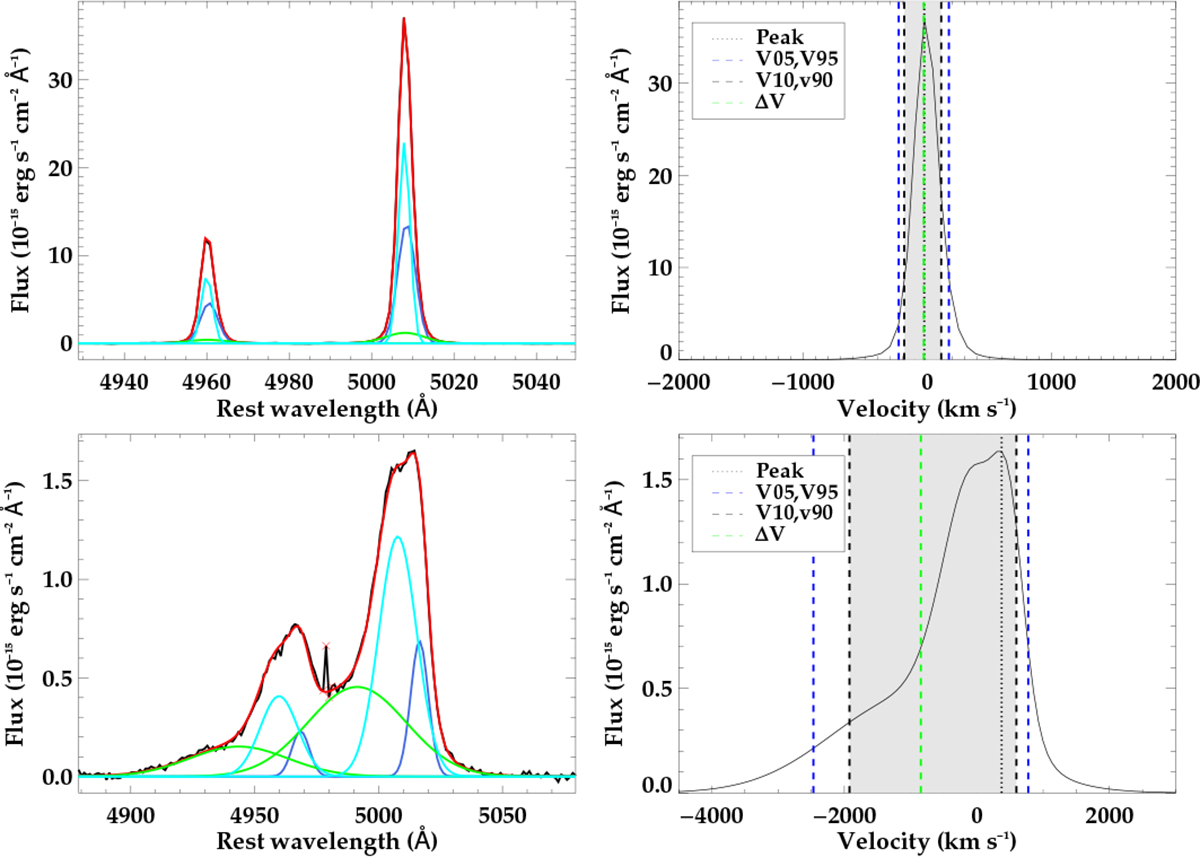
Examples of the emission line fitting technique used. The left panels show examples of the Gaussian fits obtained using MPFIT to J1300+54 and J1347+12, which have the narrowest and broadest line profiles in the sample. The black line shows the data and the red line shows the sum of the Gaussian components which are denoted in shades of blue and green. The red crosses show pixels that were masked out of the fit. The right panels show the corresponding non-parametric values derived from the emission line models. All the emission line fits are shown in Appendix https://zenodo.org/records/11965868.
Current usage metrics show cumulative count of Article Views (full-text article views including HTML views, PDF and ePub downloads, according to the available data) and Abstracts Views on Vision4Press platform.
Data correspond to usage on the plateform after 2015. The current usage metrics is available 48-96 hours after online publication and is updated daily on week days.
Initial download of the metrics may take a while.