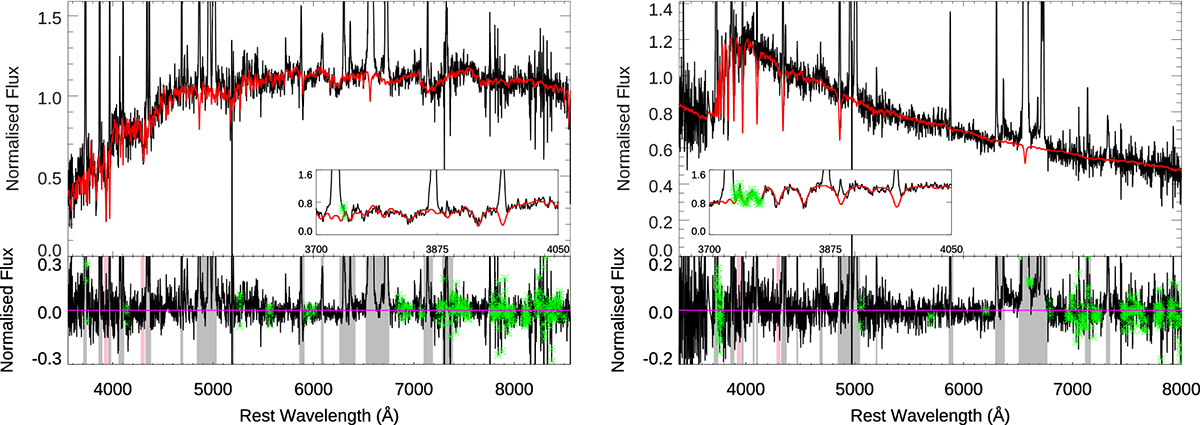
Fig. 2.
Download original image
Two examples of the results of the STARLIGHT fitting. The left panel shows the fit to J0818+36, which has a low fraction of YSP (7 per cent), where the top panel shows the data in black and the overall fit in red. The bottom panel shows the residuals of the fit with the residuals in black, the regions masked out during the fit shaded in grey and those that were double-weighted shaded in pink. Pixels flagged in the SDSS spectrum are marked by green crosses and the magenta line marks zero. The inset in the top panel shows the fit in the region of the higher-order Balmer absorption features associated with young stars. The right panel shows the same but for J1548−01, which has one of the highest fractions of YSP (88 per cent). All the STARLIGHT fits are shown in Appendix https://zenodo.org/records/11965868.
Current usage metrics show cumulative count of Article Views (full-text article views including HTML views, PDF and ePub downloads, according to the available data) and Abstracts Views on Vision4Press platform.
Data correspond to usage on the plateform after 2015. The current usage metrics is available 48-96 hours after online publication and is updated daily on week days.
Initial download of the metrics may take a while.