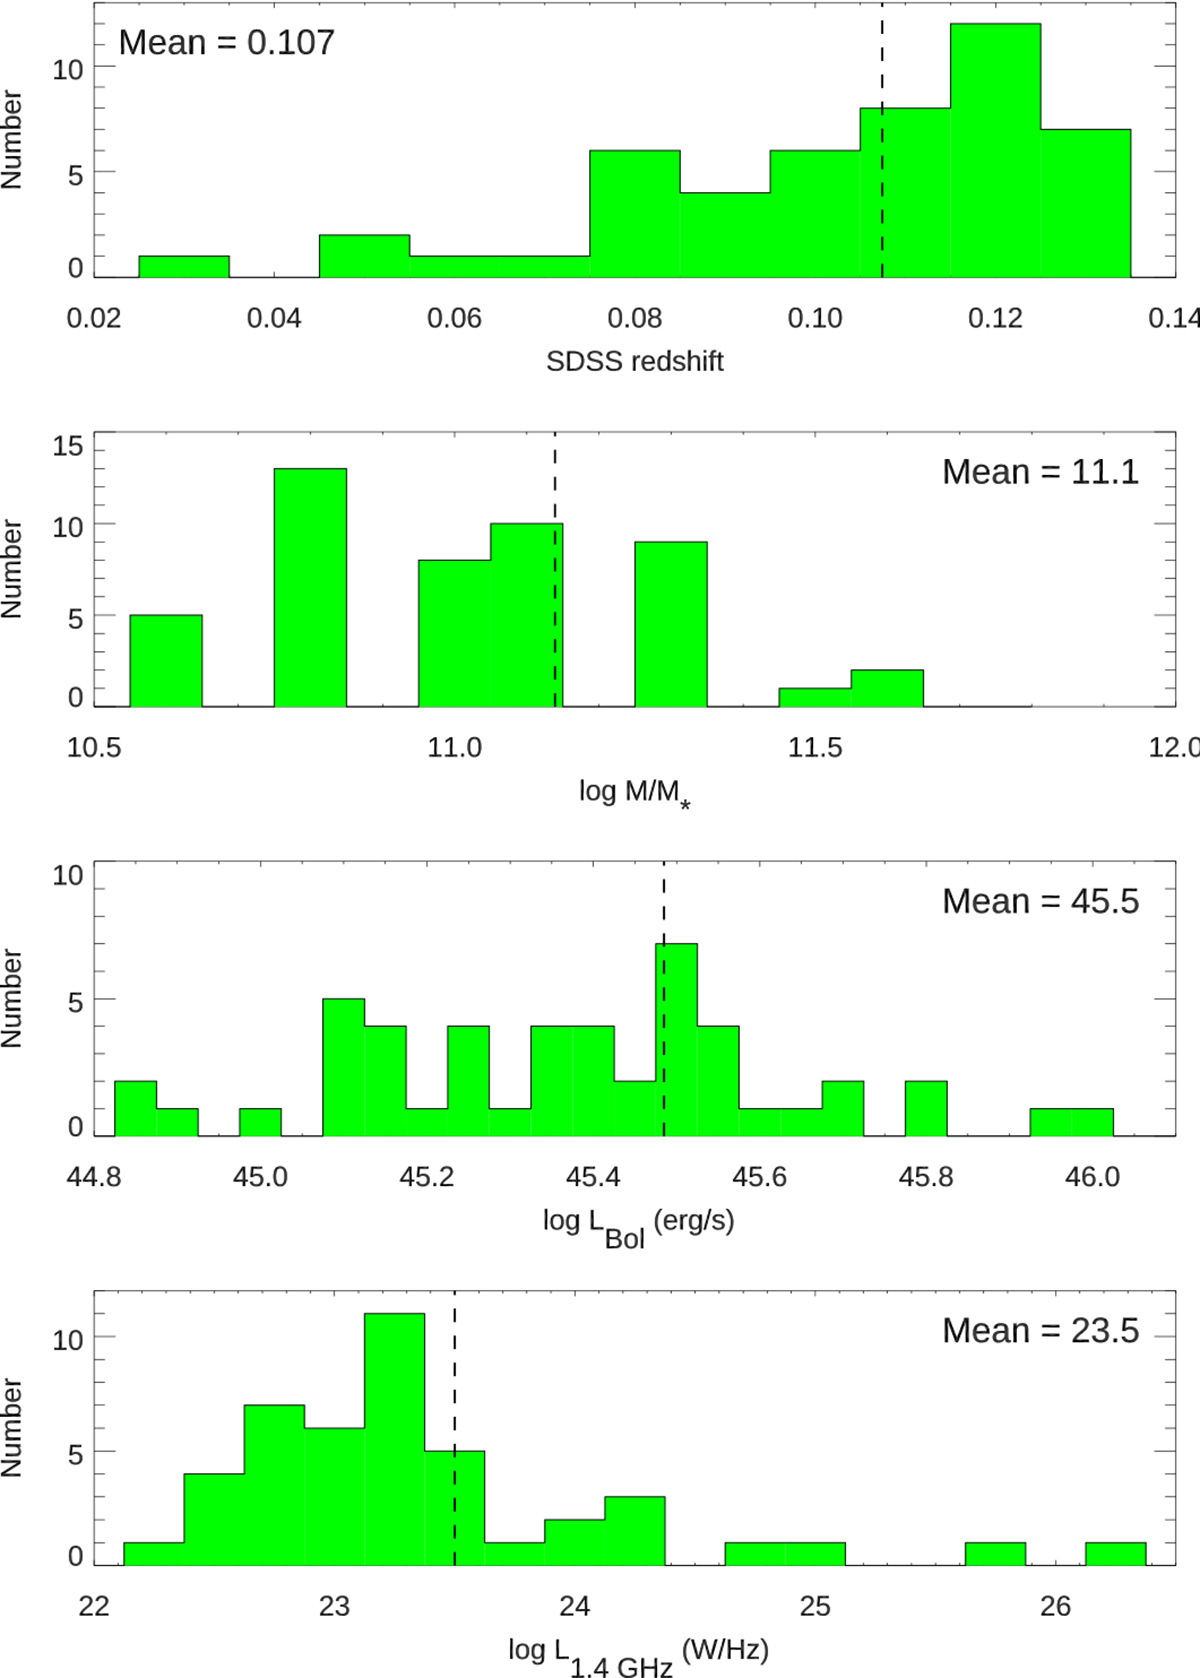
Fig. 1.
Download original image
Distribution of the key properties of the QSOFEED sample. From top to bottom, the panels show the distribution in redshift of the sample, in stellar masses of the host galaxies taken from Pierce et al. (2023), in bolometric luminosities, and in 1.4 GHz radio luminosities. Only objects that have either FIRST or NVSS detections are included in the bottom panel and upper limits are given in Table A.1. The mean value for each property is given in the individual panels.
Current usage metrics show cumulative count of Article Views (full-text article views including HTML views, PDF and ePub downloads, according to the available data) and Abstracts Views on Vision4Press platform.
Data correspond to usage on the plateform after 2015. The current usage metrics is available 48-96 hours after online publication and is updated daily on week days.
Initial download of the metrics may take a while.