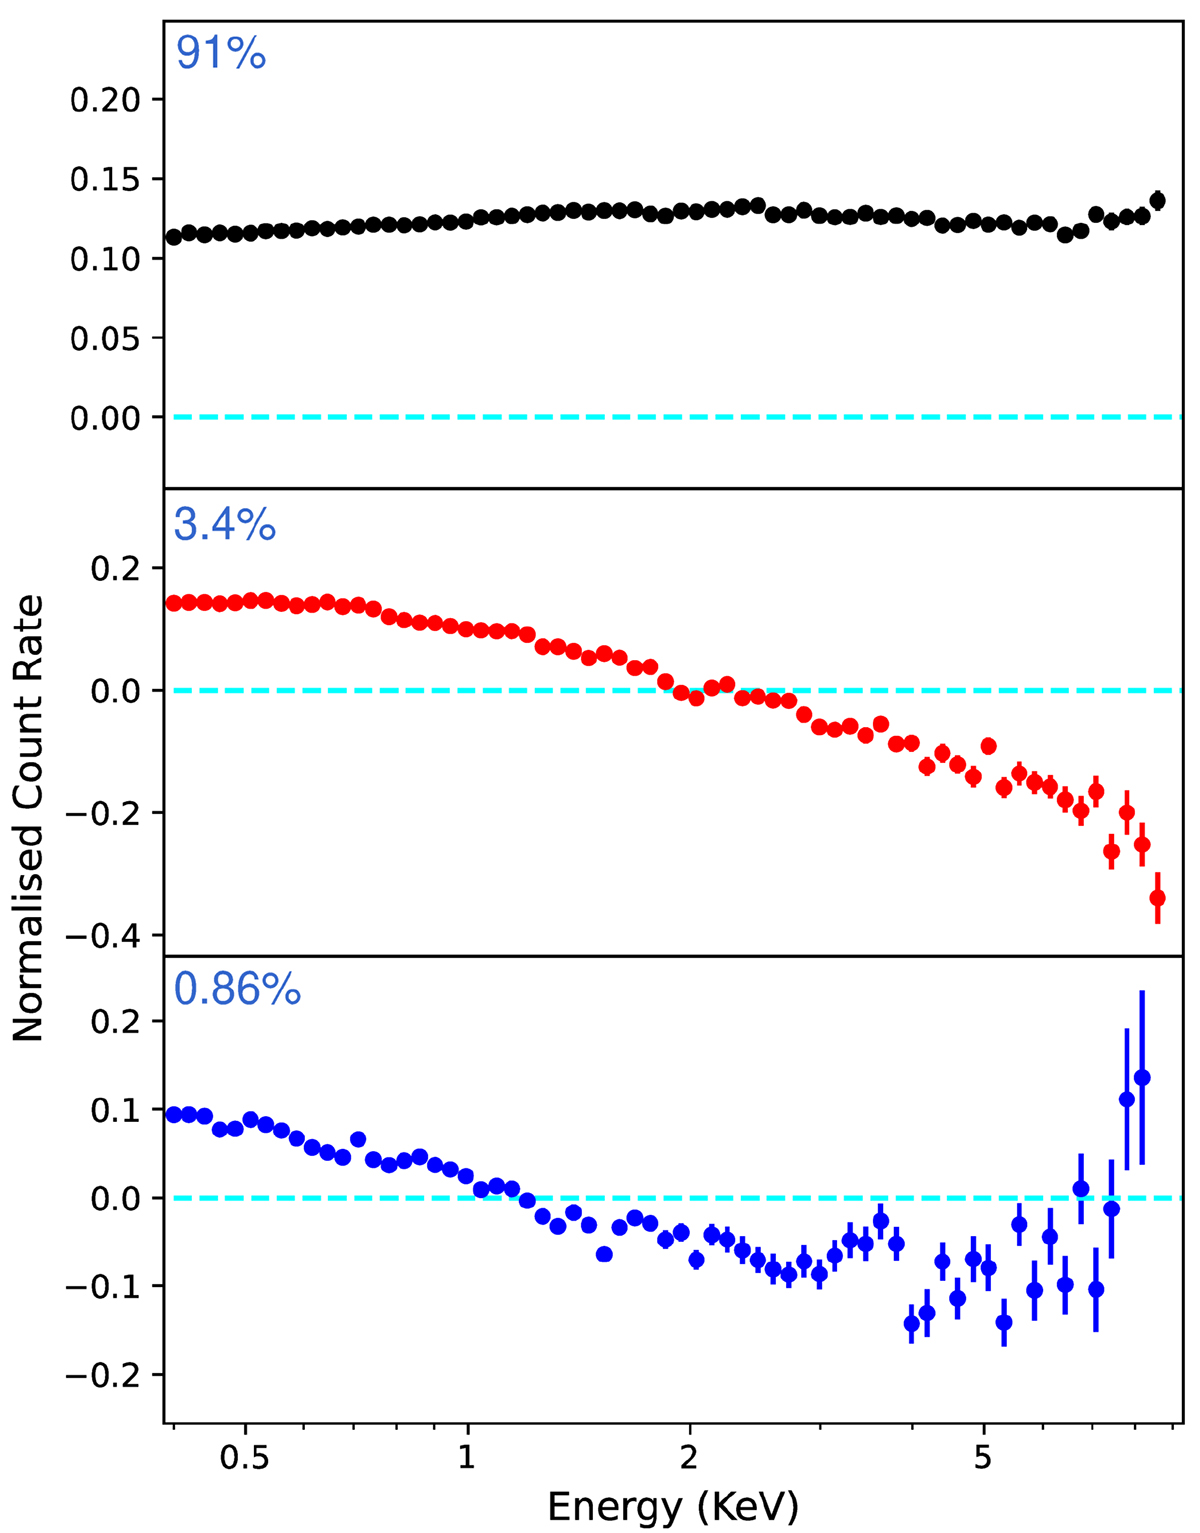
Fig. 1.
Download original image
Normalized spectra of the first three significant components (top to bottom) of the Ark 564 between 0.4–9.0 keV. We used the black, red and blue to mark the first, second, and third principle component, respectively. We binned the spectra logarithmically into 65 energy bins and calculated the errors by perturbing the input spectra. The zero level in each panel is marked with a green dashed line. We also show the variability percentage of the component in the top left corner of each panel. For the third component, we do not include the rightmost datapoint (x = 8.6, y = 0.84) to show the detailed structure in the soft energy clearly.
Current usage metrics show cumulative count of Article Views (full-text article views including HTML views, PDF and ePub downloads, according to the available data) and Abstracts Views on Vision4Press platform.
Data correspond to usage on the plateform after 2015. The current usage metrics is available 48-96 hours after online publication and is updated daily on week days.
Initial download of the metrics may take a while.