Fig. 7.
Download original image
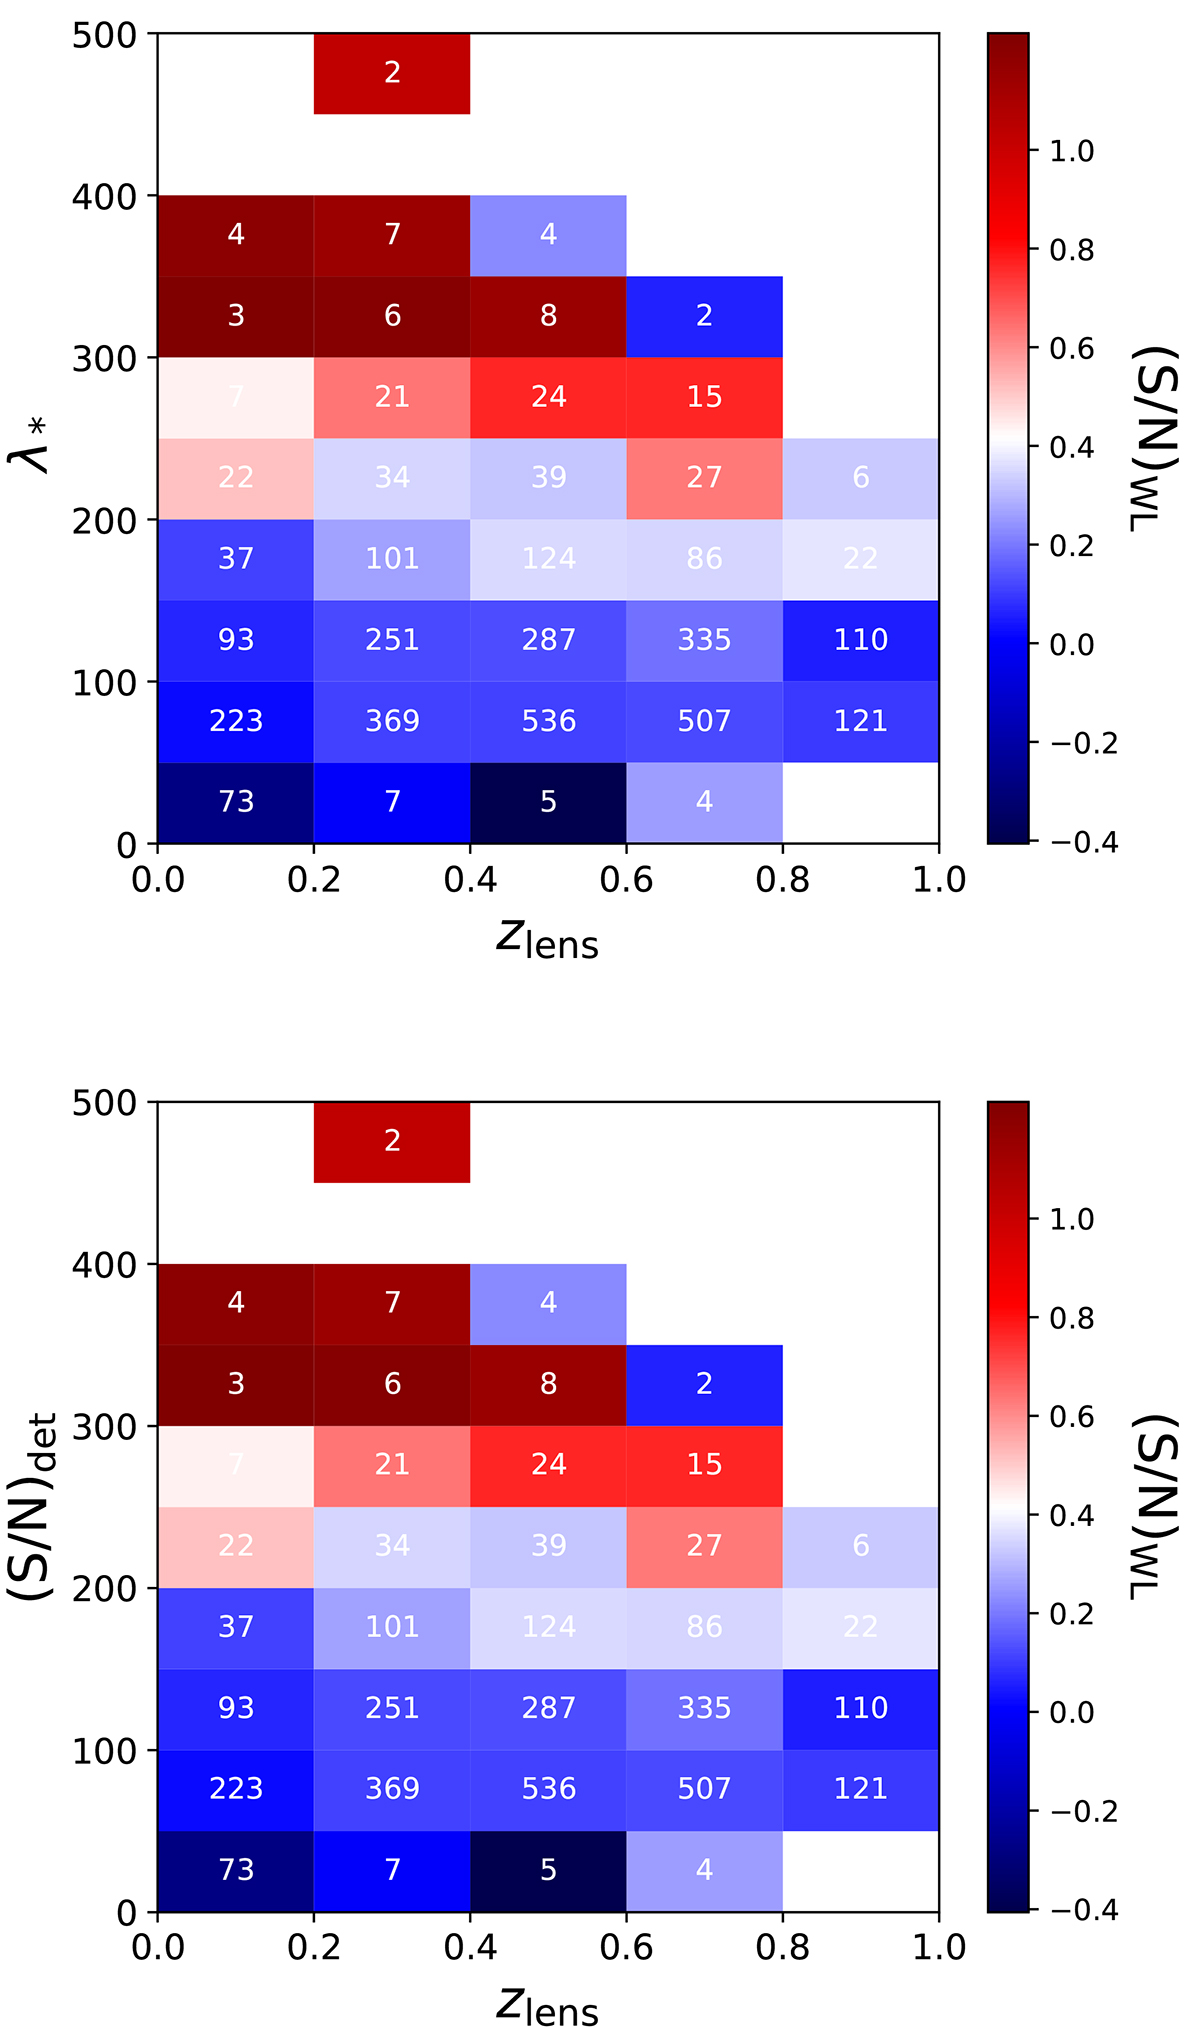
(S/N)WL of the clusters and groups detected by AMICO in the XXL-North field of HSC-SSP. Top: (S/N)WL as a function of redshift and richness. The (S/N)WL is computed as the median value for the candidate groups in the bin, and (S/N)WL is colour-coded as shown in the right bar. The number of candidates is superimposed in each bin. Bottom: Same as in the top panel for (S/N)WL as a function of redshift and (S/N)det. In other words, this panel shows the S/N of the optical detection of the algorithm.
Current usage metrics show cumulative count of Article Views (full-text article views including HTML views, PDF and ePub downloads, according to the available data) and Abstracts Views on Vision4Press platform.
Data correspond to usage on the plateform after 2015. The current usage metrics is available 48-96 hours after online publication and is updated daily on week days.
Initial download of the metrics may take a while.