Open Access
Fig. 3.
Download original image
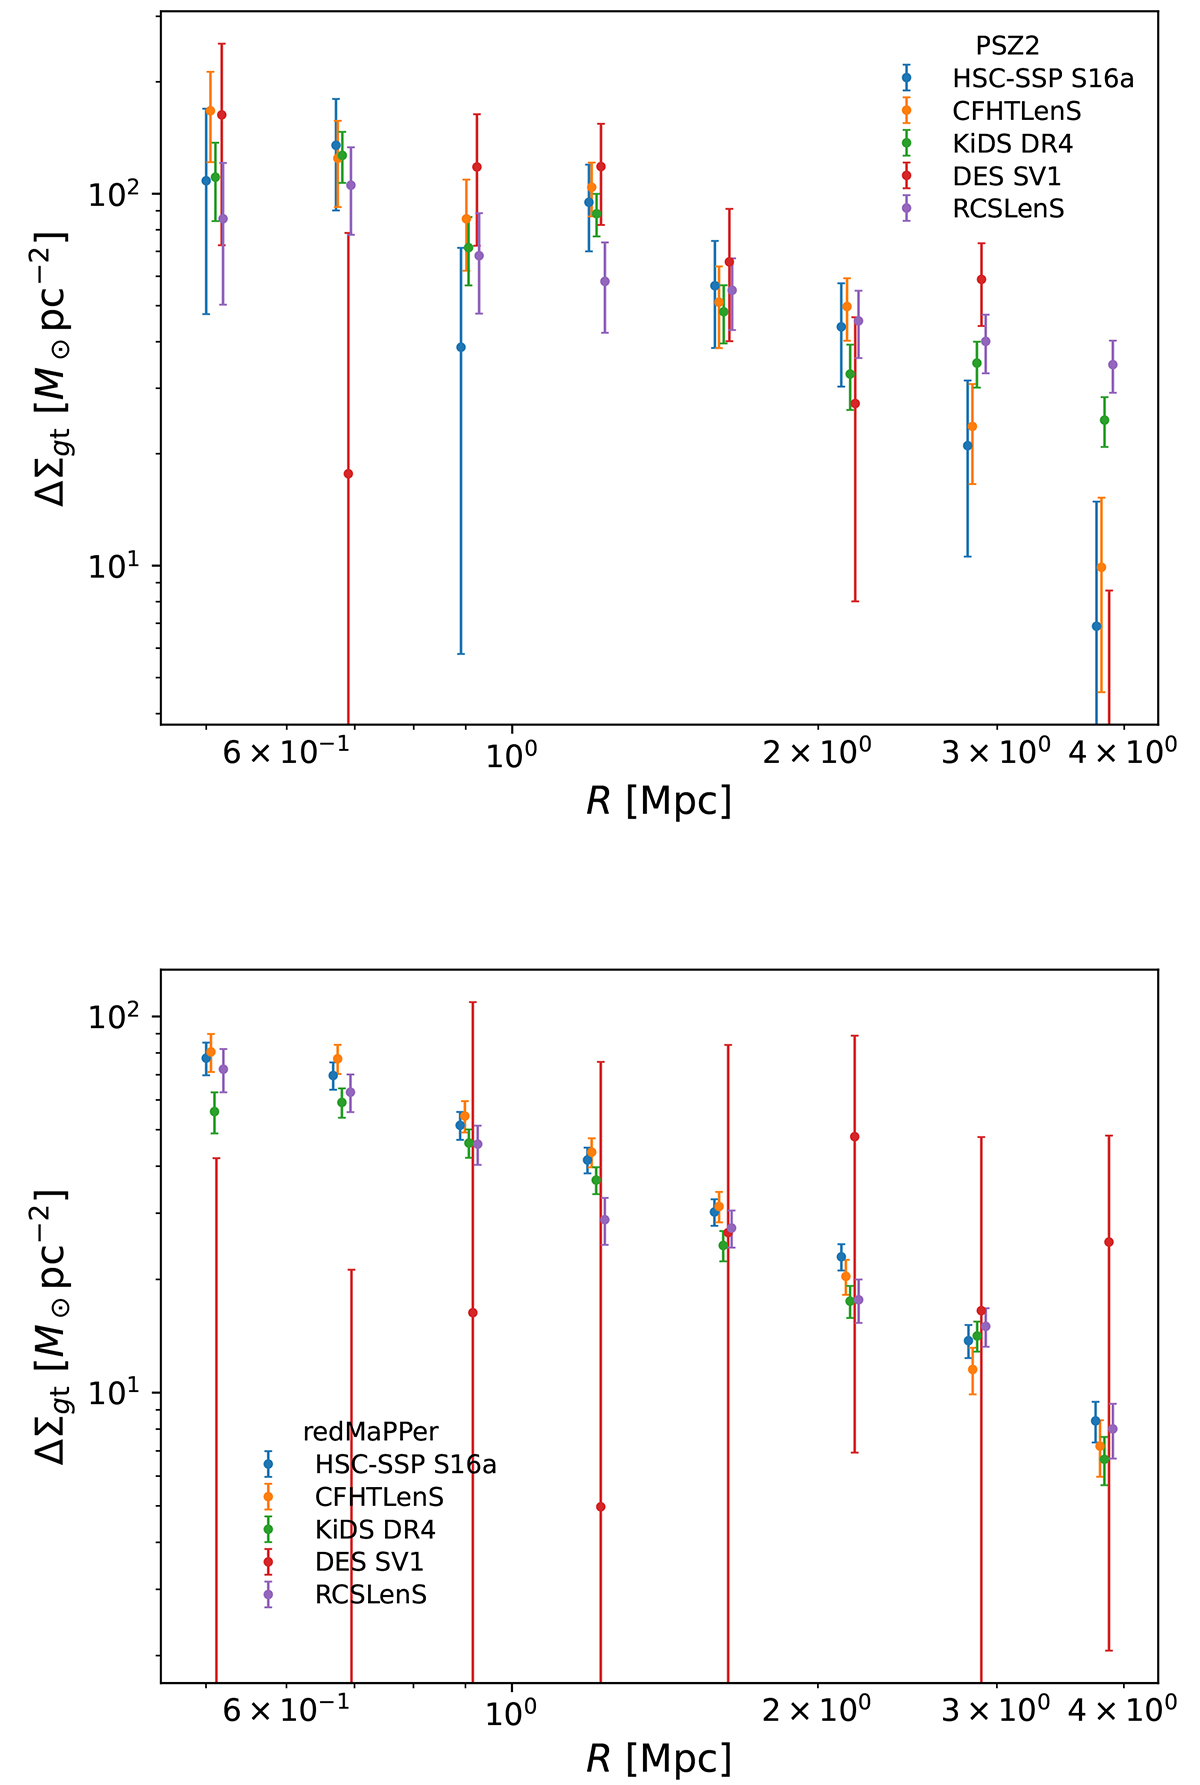
Average reduced excess surface density profiles of clusters detected in public surveys as a function of R, the transverse proper distance from the lens centre, coded by colours as in the legend. Top: PSZ2 clusters. Bottom: Sample of redMaPPer.
Current usage metrics show cumulative count of Article Views (full-text article views including HTML views, PDF and ePub downloads, according to the available data) and Abstracts Views on Vision4Press platform.
Data correspond to usage on the plateform after 2015. The current usage metrics is available 48-96 hours after online publication and is updated daily on week days.
Initial download of the metrics may take a while.