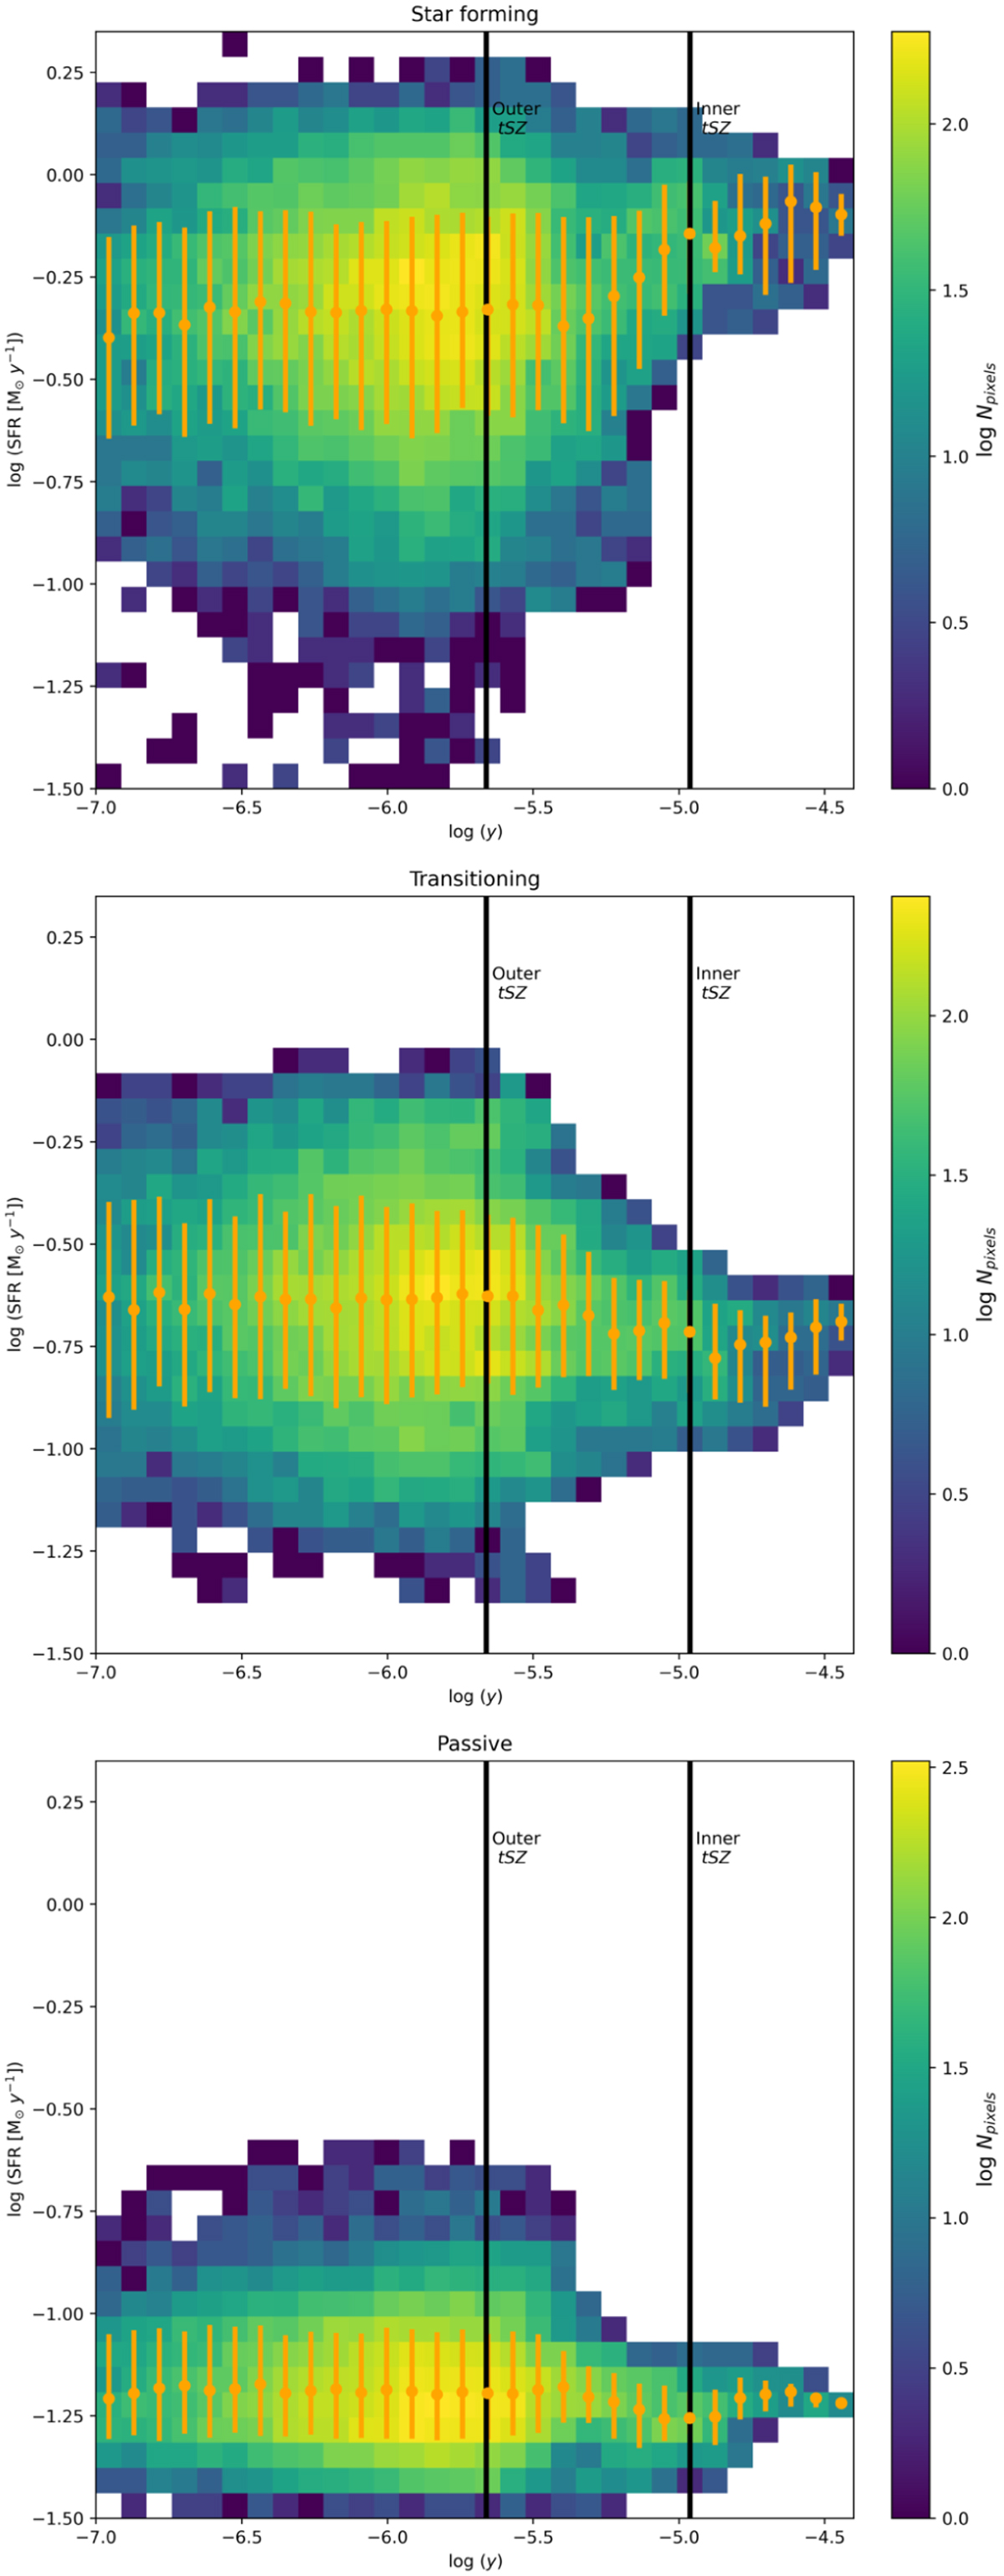
Fig. 9
Download original image
SFR and Compton y relation for star-forming (upper panel), transitioning (middle panel), and passive galaxies (lower panel) in the zoom-in region of SSC. The colour scale indicates the number of pixels for each combination of SFR and y. The dots and bars are the median and 68% distribution, respectively. Vertical black lines correspond to the same tSZ outer (solid orange, youter = 2.2 × 10⁻⁶) and inner (dashed black, yinner = 1.1 × 10⁻⁵) contours in Fig. 4.
Current usage metrics show cumulative count of Article Views (full-text article views including HTML views, PDF and ePub downloads, according to the available data) and Abstracts Views on Vision4Press platform.
Data correspond to usage on the plateform after 2015. The current usage metrics is available 48-96 hours after online publication and is updated daily on week days.
Initial download of the metrics may take a while.