Fig. 8
Download original image
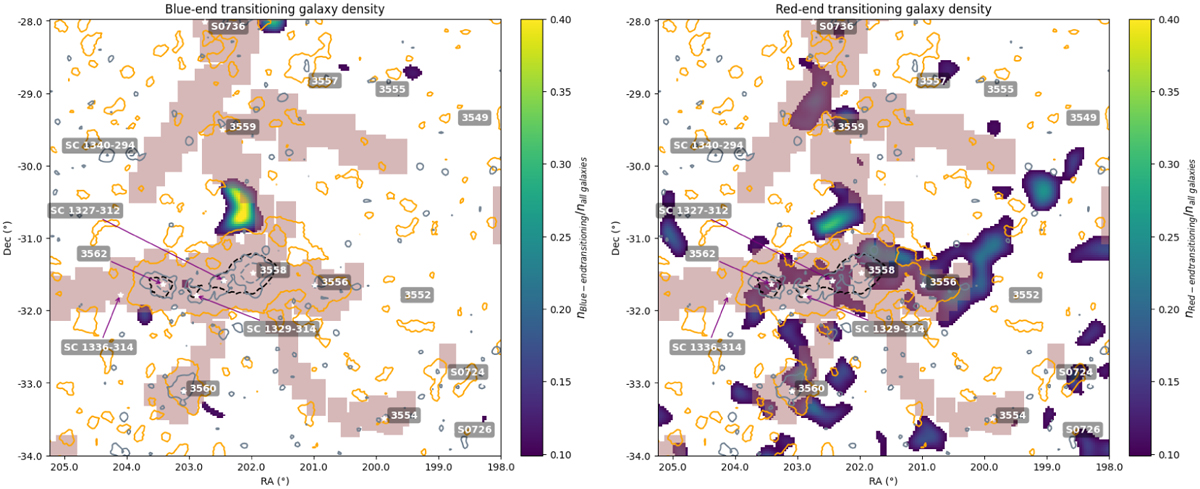
Same as lower left panel in Fig. 4 but with the blue-end transitioning galaxies (lower d2ms hence more star-forming) on the left and the red-end transitioning galaxies (higher d2ms hence more passive) on the right. The colour bar is adjusted to better highlight the differences. As in previous figures, white stars are known clusters and the grey areas correspond to detected filaments.
Current usage metrics show cumulative count of Article Views (full-text article views including HTML views, PDF and ePub downloads, according to the available data) and Abstracts Views on Vision4Press platform.
Data correspond to usage on the plateform after 2015. The current usage metrics is available 48-96 hours after online publication and is updated daily on week days.
Initial download of the metrics may take a while.