Open Access
Fig. 6
Download original image
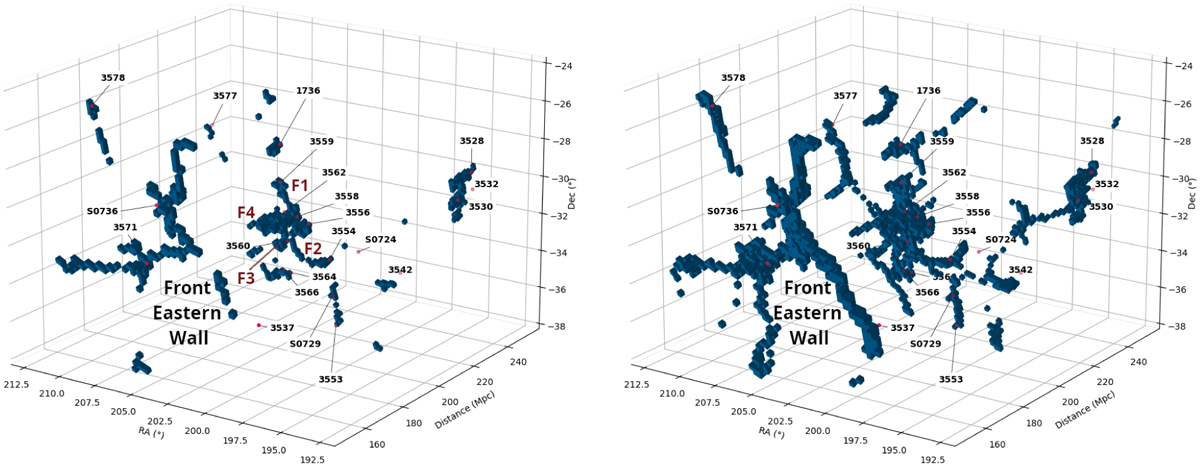
3D visualisation of the T-ReX filaments around SSC, with a probability above 0.5 (left), defined as our baseline for reliable filaments, and a lower probability of 0.2 (right). The green dots correspond to the clusters from Proust et al. (2006a).
Current usage metrics show cumulative count of Article Views (full-text article views including HTML views, PDF and ePub downloads, according to the available data) and Abstracts Views on Vision4Press platform.
Data correspond to usage on the plateform after 2015. The current usage metrics is available 48-96 hours after online publication and is updated daily on week days.
Initial download of the metrics may take a while.