Open Access
Fig. 5
Download original image
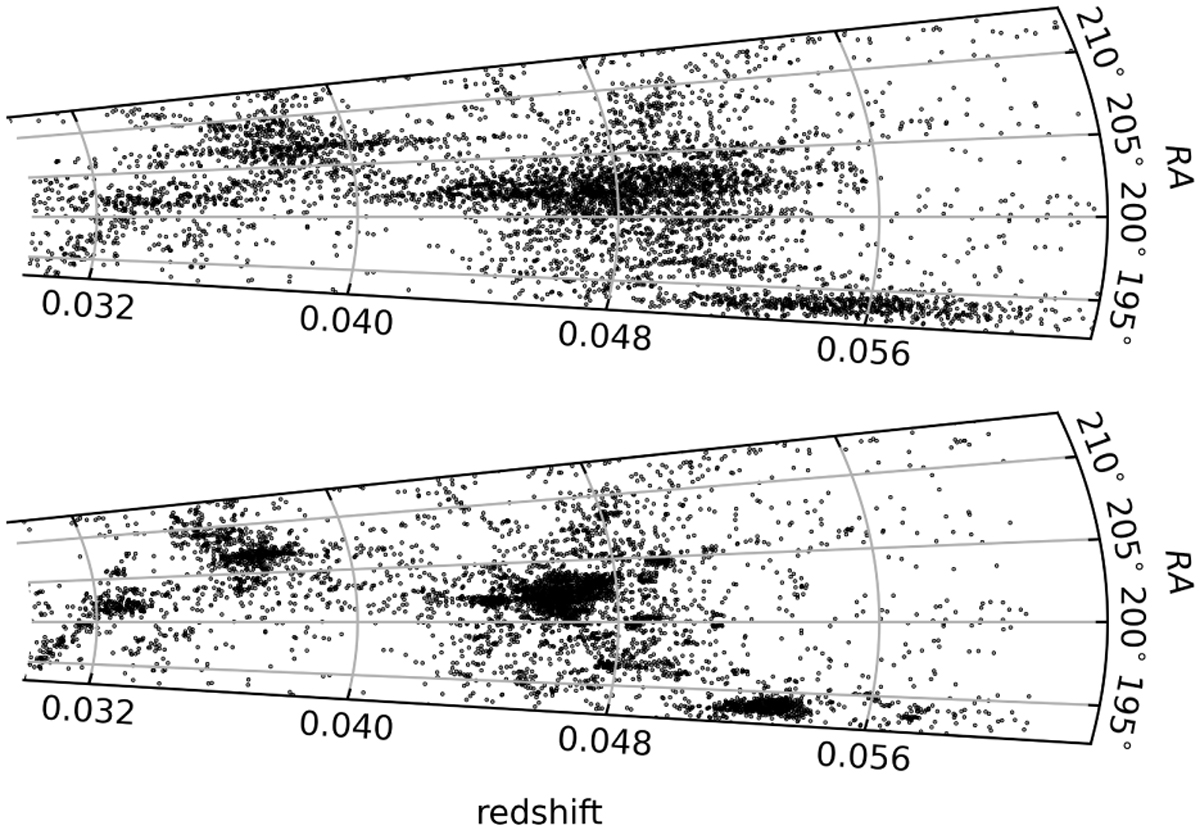
Spatial distribution of the Shapley supercluster’s galaxies. Upper panel: each black dot corresponds to a spectroscopic galaxy selected from Quintana et al. (2020) such that R2 < 18 mag and 9000 < υ < 18 900 km/s. Lower panel: same galaxies after correcting for the FoG effect following Sec. 2.3.
Current usage metrics show cumulative count of Article Views (full-text article views including HTML views, PDF and ePub downloads, according to the available data) and Abstracts Views on Vision4Press platform.
Data correspond to usage on the plateform after 2015. The current usage metrics is available 48-96 hours after online publication and is updated daily on week days.
Initial download of the metrics may take a while.