Fig. 4
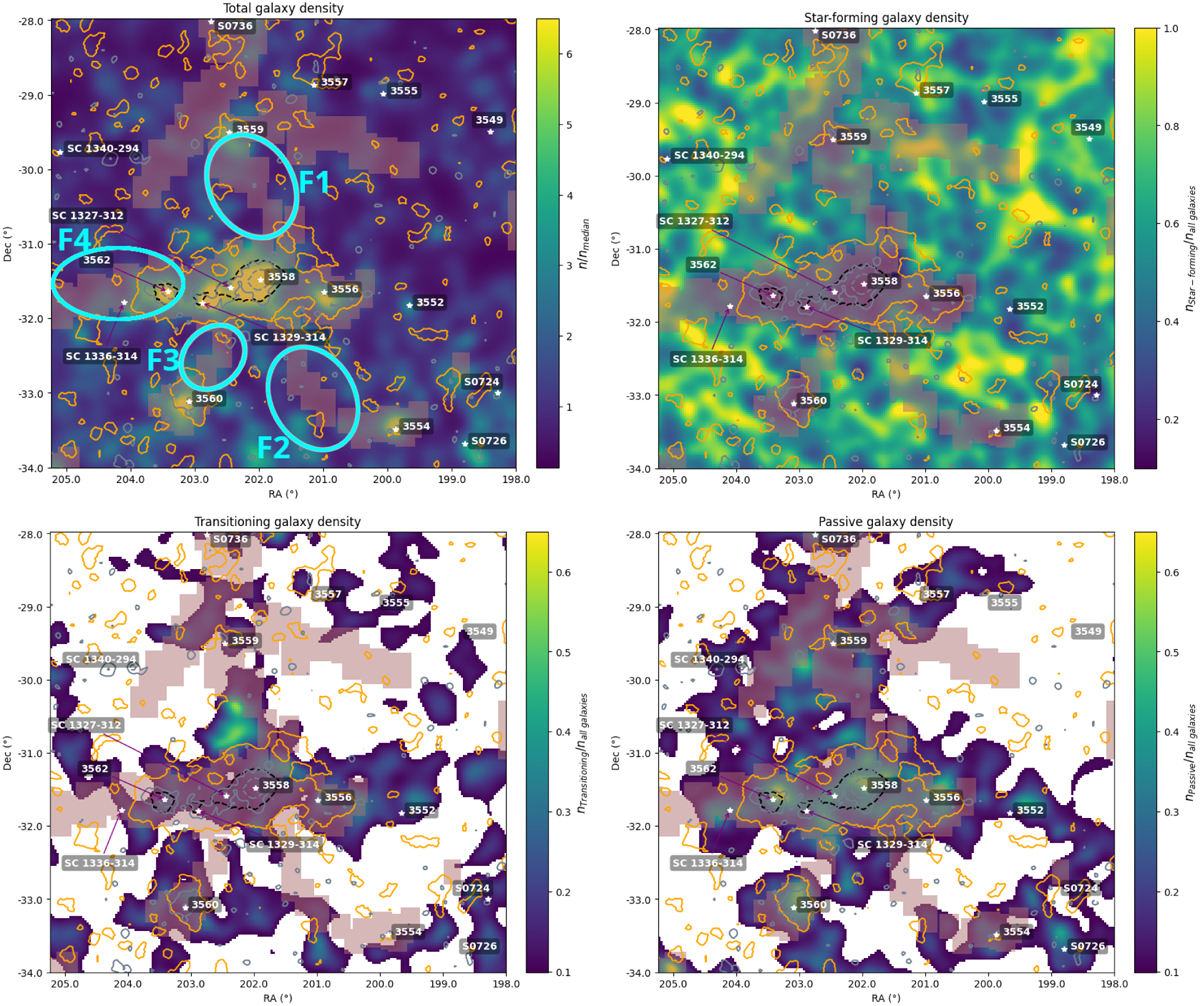
Download original image
Upper left: same as Fig. 3 but with T-REx filaments shown in grey areas. The main detected filaments are indicated with cyan ellipses. Upper right: zoom-in region around the SSC system with normalised number density of star-forming galaxies. Lower right and left: same as upper right but for transitioning and passive galaxies, respectively. The white areas correspond to normalised number density values such that npopulation/nall/galaxies < 0.1. The white stars correspond to known clusters, projected 3D filaments are indicated by grey areas, while orange and turquoise contours correspond to the tSZ and X-ray signals, respectively.
Current usage metrics show cumulative count of Article Views (full-text article views including HTML views, PDF and ePub downloads, according to the available data) and Abstracts Views on Vision4Press platform.
Data correspond to usage on the plateform after 2015. The current usage metrics is available 48-96 hours after online publication and is updated daily on week days.
Initial download of the metrics may take a while.