Fig. 3
Download original image
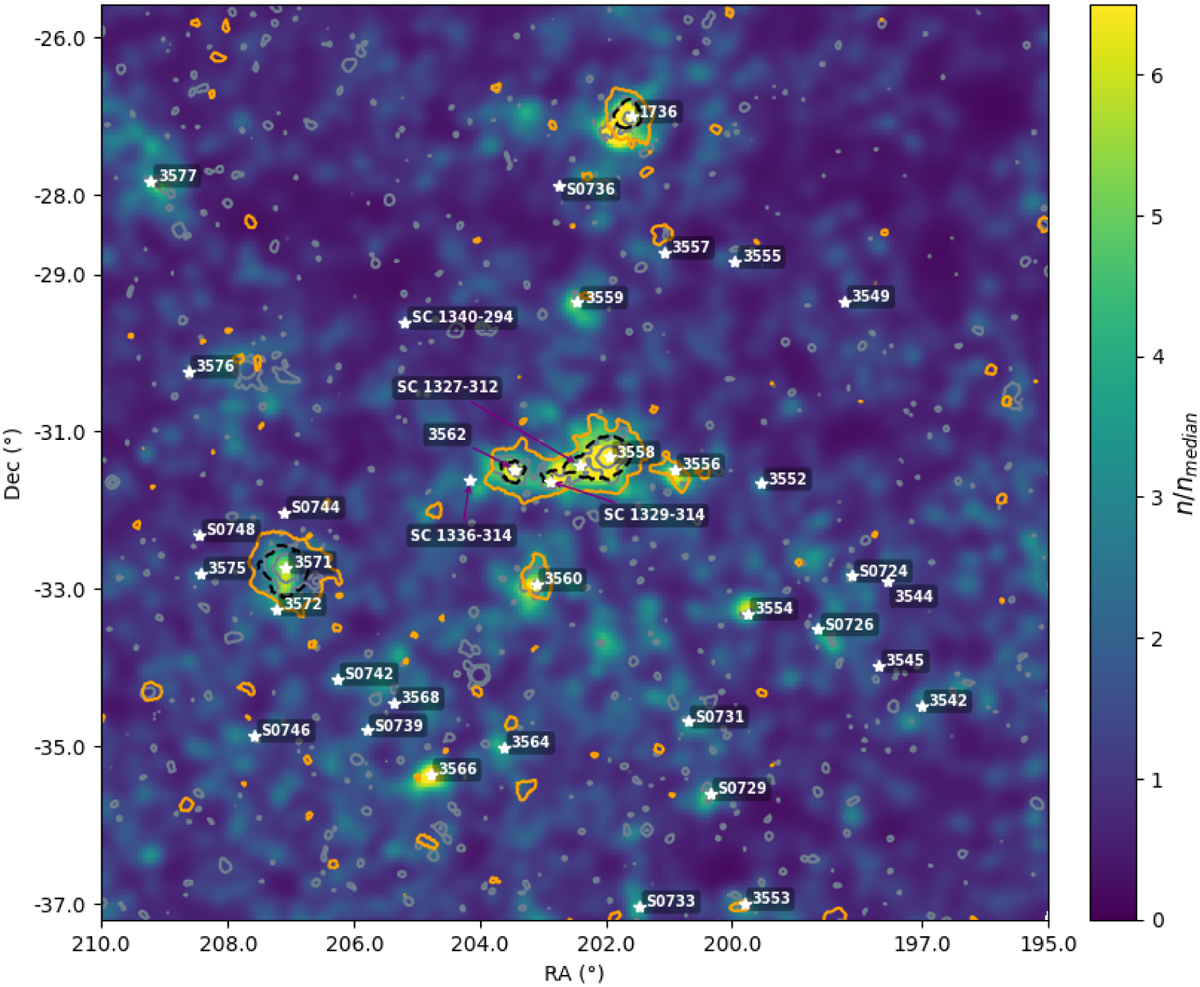
Image centred on the Shapley Supercluster within a redshift range of 0.03 < z < 0.083. White stars indicate known clusters from Proust et al. (2006a). The colour scale represents the galaxy number density, normalised by the median density in each pixel. The outer solid orange contours and inner dashed black contours correspond to Compton y parameter values of 4.4 × 10⁻⁶ and 1.1 × 10⁻⁵, respectively, in the tSZ reconstructed map from the Planck all-sky survey. The outer and inner grey contours correspond to an X-ray signal of 2000 and 104 counts s−1 arcmin−2, respectively, in the ROSAT all-sky survey map.
Current usage metrics show cumulative count of Article Views (full-text article views including HTML views, PDF and ePub downloads, according to the available data) and Abstracts Views on Vision4Press platform.
Data correspond to usage on the plateform after 2015. The current usage metrics is available 48-96 hours after online publication and is updated daily on week days.
Initial download of the metrics may take a while.