Fig. 11
Download original image
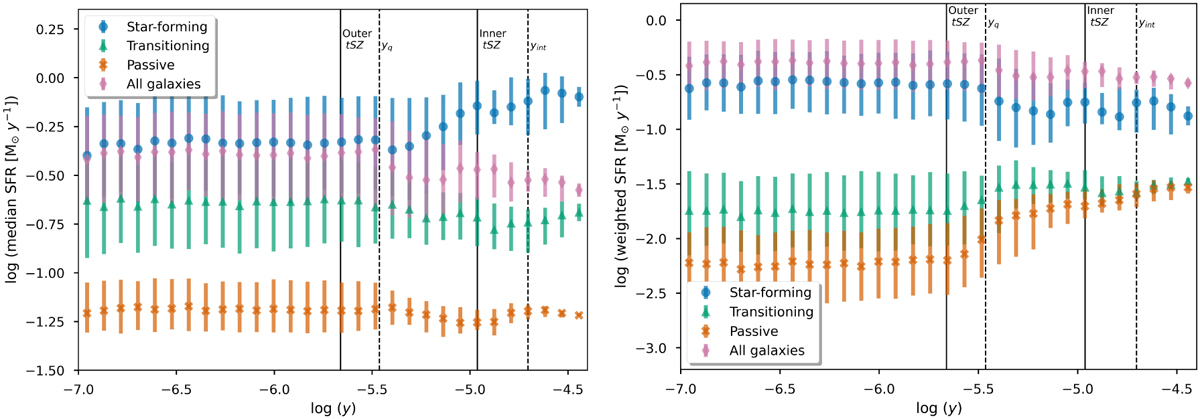
Median SFR values for all three galaxy populations (star-forming, transitioning, and passive) as a function of the tSZ y parameter (left panel). Distribution of the median SFR weighted by the fraction of galaxy density of a given population with respect to the total as a function of the tSZ y parameter (right panel). In both panels, error bars indicate the 68% distribution around the median. Vertical solid lines correspond to the tSZ outer (youter = 2.2 × 10⁻⁶) and inner (yinner = 1.1 × 10⁻⁵) contours. Vertical dashed lines represent y values at which the slopes of the SFR-tSZ relation significantly change (see text).
Current usage metrics show cumulative count of Article Views (full-text article views including HTML views, PDF and ePub downloads, according to the available data) and Abstracts Views on Vision4Press platform.
Data correspond to usage on the plateform after 2015. The current usage metrics is available 48-96 hours after online publication and is updated daily on week days.
Initial download of the metrics may take a while.