Fig. 8.
Download original image
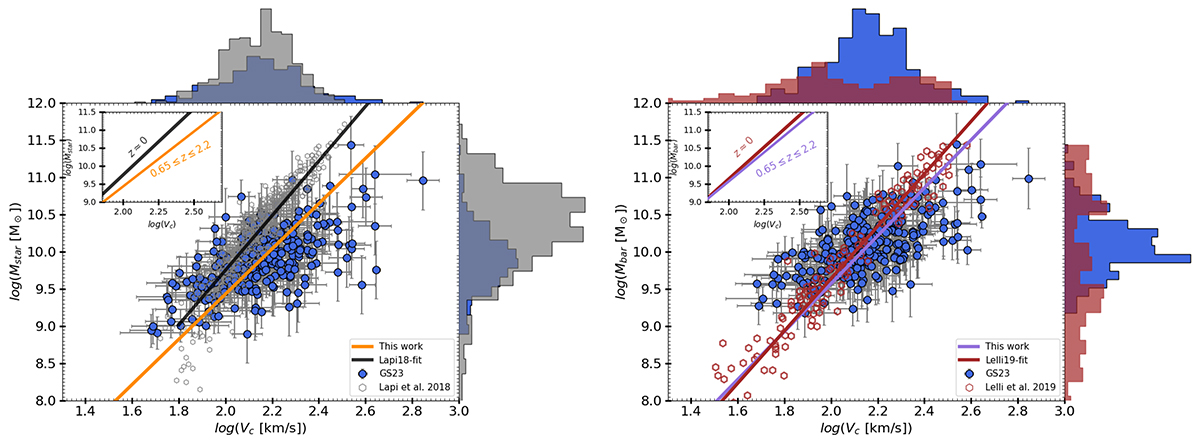
Comparison of STFR and BTFR with local studies. Left Panel: STFR comparison between the GS23 dataset (blue filled circles) and Lapi2018 (gray open circles). The best fit for Lapi2018 is represented by the black solid line, while the best-fit of this work (on GS23 data) is shown in orange. Right Panel: BTFR comparison between the GS23 dataset (blue filled circles) and Lelli2019 (brown open circles). The best fit for Lelli2019 is indicated by the brown solid line, while the best-fit of this work in purple. In both panels, the inset provides a zoomed-in view of the local and high-z fits within the range 9.0 ≤ log(Mstar/bar [M⊙]) ≤ 11.5 and 1.65 ≤ log(Vc [km/s]) ≤ 2.75. Additionally, for dataset comparison, histograms of the x and y axes are included: Lapi2018 in gray, Lelli2019 in brown and GS23 in blue. In both the STFR and BTFR cases, we observe a divergent evolution in the slope, while the zero-point remains uncertain due to the absence of low-mass galaxies at high redshifts.
Current usage metrics show cumulative count of Article Views (full-text article views including HTML views, PDF and ePub downloads, according to the available data) and Abstracts Views on Vision4Press platform.
Data correspond to usage on the plateform after 2015. The current usage metrics is available 48-96 hours after online publication and is updated daily on week days.
Initial download of the metrics may take a while.