Fig. 6.
Download original image
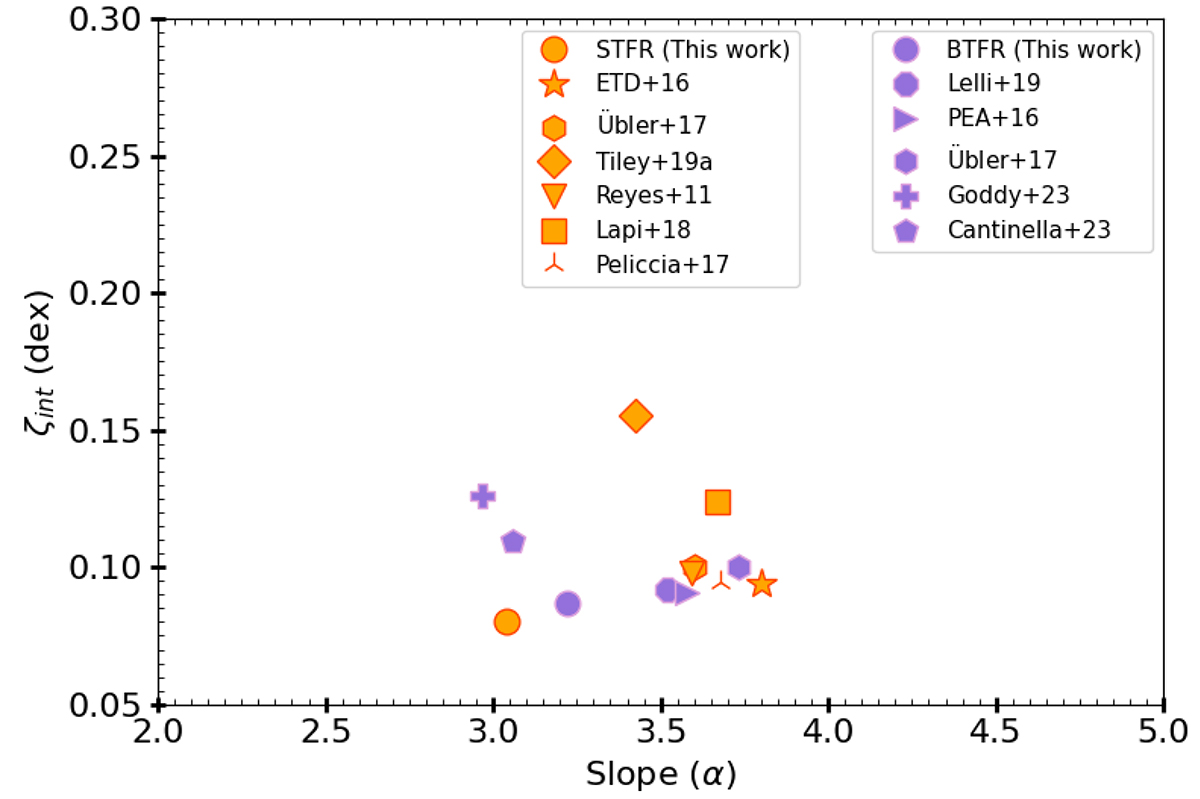
Comparison of slopes and intrinsic scatters: we take the best-fits of previous studies as a face-value (x-axis) and apply them on our dataset to compute the orthogonal intrinsic scatter (y-axis) around the adopted best-fit lines. STFR studies are represented by orange markers, BTFR studies by purple, with each marker corresponding to a distinct study listed in the legends.
Current usage metrics show cumulative count of Article Views (full-text article views including HTML views, PDF and ePub downloads, according to the available data) and Abstracts Views on Vision4Press platform.
Data correspond to usage on the plateform after 2015. The current usage metrics is available 48-96 hours after online publication and is updated daily on week days.
Initial download of the metrics may take a while.