Fig. 5.
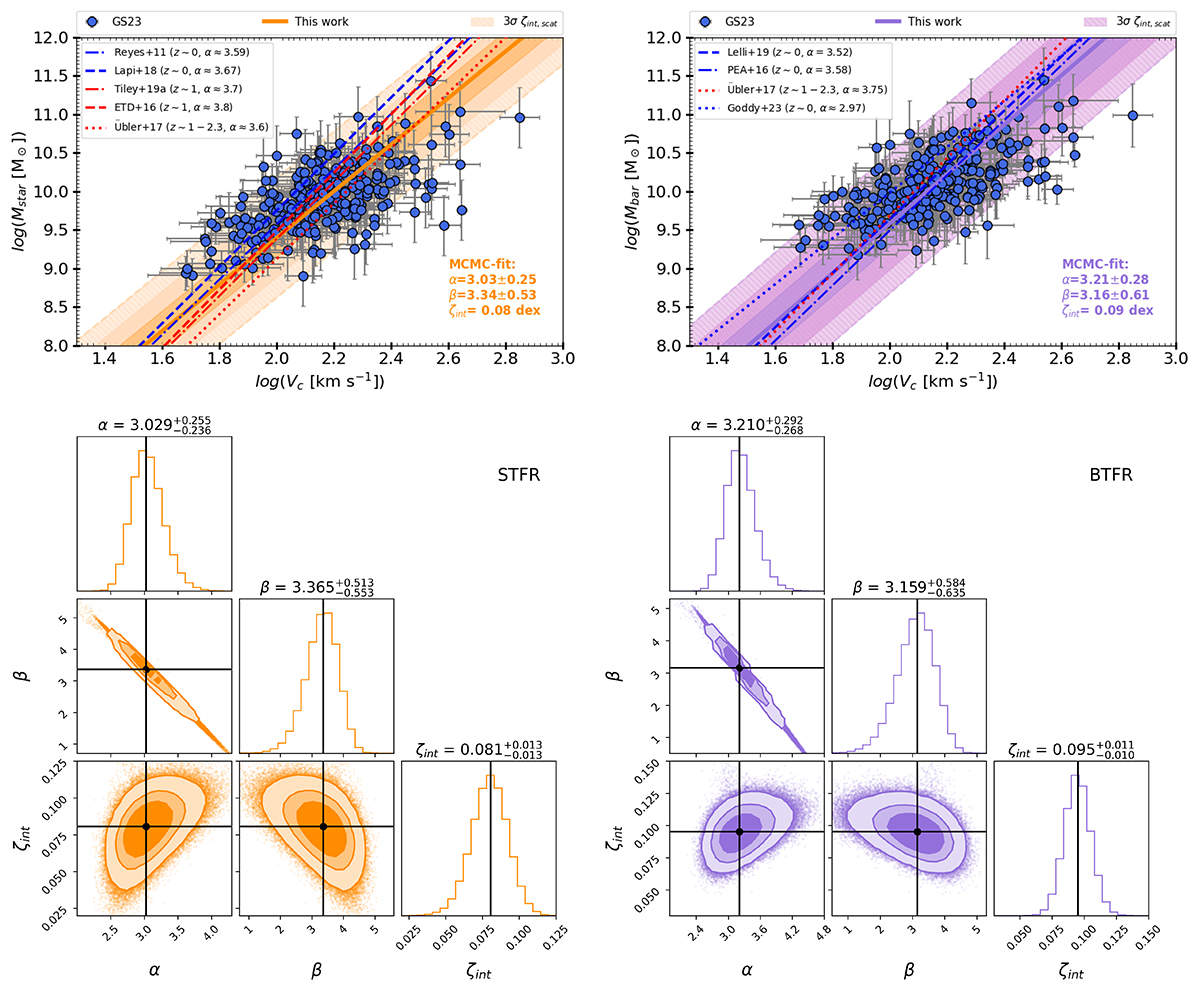
Download original image
Stellar and baryonic Tully-Fisher relations (STFR and BTFR), presented in the top-left and top-right panels, respectively. The blue-filled circles represent the data from Sharma et al. (2023), with gray error bars denoting uncertainties on each measurements. The solid orange and purple lines shows the best-fit curves obtained in this study using orthogonal likelihood, accompanied by the shaded regions representing the 3σ intrinsic scatter for the STFR and BTFR, respectively. The bottom-right corner of each plot displays the best-fit parameters. Additionally, the blue lines correspond to comparisons with local studies, while red lines represent the high-redshift data, as indicated in the upper left legend of each plot. The lower panel shows the posterior distributions (corner plots) resulting from the MCMC fitting process for the STFR and BTFR, shown in the left and right plots, respectively. The contours within these corner plots illustrate the 68%, 90%, and 99% credible intervals. For reference, we also show vertical likelihood fits of STFR and BTFR in Fig. D.1, which shows a huge difference in the slope and zero-point of the relation with respect to orthogonal likelihood. We report a difference of a factor of about 2.
Current usage metrics show cumulative count of Article Views (full-text article views including HTML views, PDF and ePub downloads, according to the available data) and Abstracts Views on Vision4Press platform.
Data correspond to usage on the plateform after 2015. The current usage metrics is available 48-96 hours after online publication and is updated daily on week days.
Initial download of the metrics may take a while.