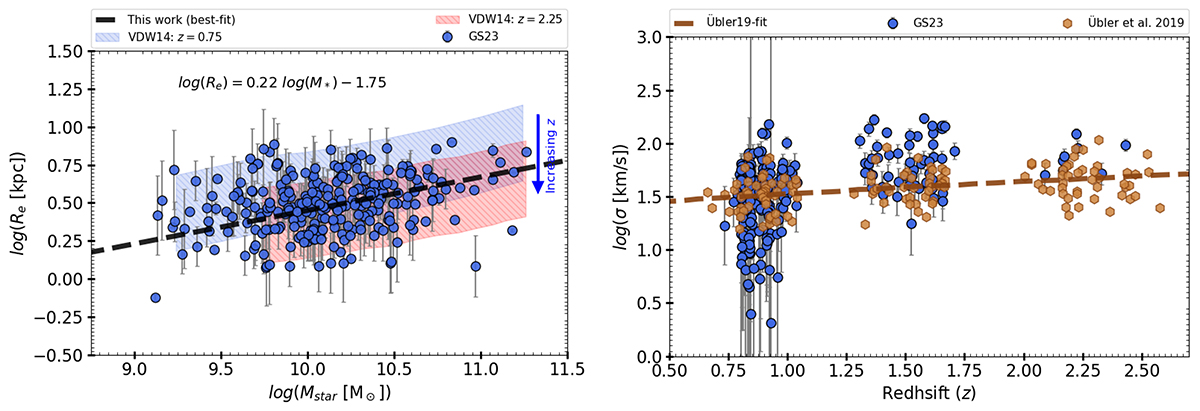
Fig. 4.
Download original image
Mass-size relation of late-type galaxies (left). The blue filled circles represents the data (of Sharma et al. 2023, employed in this work), and black dashed line shows the best-fit (slope and offset marked on plot). The blue and red shaded areas represent the mass-size relation of van der Wel et al. (2014) at z = 0.75 and z = 2.25, respectively. Ionized gas velocity dispersion as a function of redshift (right). The blue filled circles and brown hexagons represent the Sharma et al. (2023) and Übler et al. (2019) data, respectively. The brown dashed line represents the best fit of Übler et al. (2019) work. We notice that 73 out of the 263 (27.7%) galaxies from the Sharma et al. (2023) sample are common in the two datasets.
Current usage metrics show cumulative count of Article Views (full-text article views including HTML views, PDF and ePub downloads, according to the available data) and Abstracts Views on Vision4Press platform.
Data correspond to usage on the plateform after 2015. The current usage metrics is available 48-96 hours after online publication and is updated daily on week days.
Initial download of the metrics may take a while.