Fig. 3.
Download original image
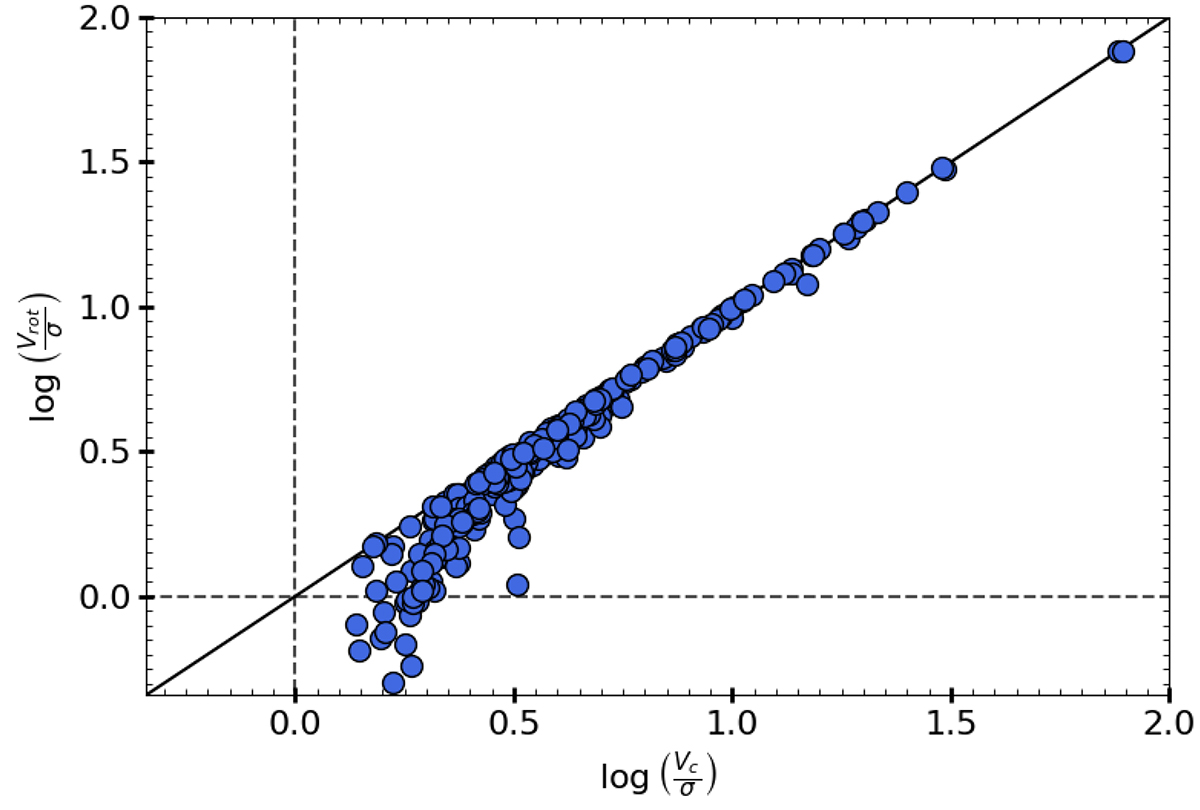
Intrinsic and pressure-support-corrected rotation-to-dispersion ratio (V/σ), plotted on the y- and x-axes, respectively. The solid black line represents the one-to-one relation between the two quantities. The vertical and horizontal dashed lines indicate the V/σ > 1 limit for intrinsic and pressure-support-corrected rotation-to-dispersion ratios, respectively. This figure indicates that, after pressure support corrections, none of the GS23 galaxies exhibit dispersion-dominated characteristics. Therefore, we utilize the entire GS23 sample for the TFR study.
Current usage metrics show cumulative count of Article Views (full-text article views including HTML views, PDF and ePub downloads, according to the available data) and Abstracts Views on Vision4Press platform.
Data correspond to usage on the plateform after 2015. The current usage metrics is available 48-96 hours after online publication and is updated daily on week days.
Initial download of the metrics may take a while.