Fig. C.2.
Download original image
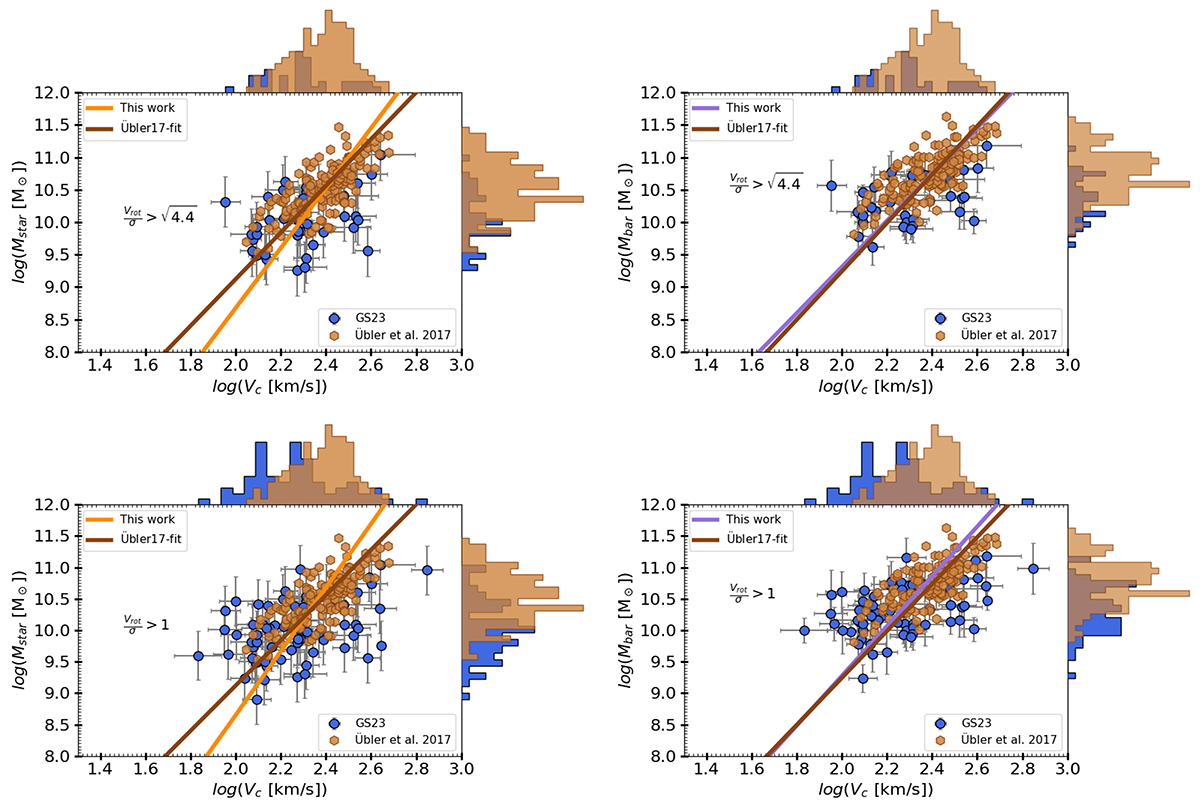
Comparison of the STFR and BTFR, using only KMOS3D sample studied in GS23 datasets, with Übler et al. (2017). In the top panel figures, we restrict the analysis for ![]() , whereas in the bottom panels, we analyze the full KMOS3D sample studied in GS23 for Vrot/σ > 1. Left Panels: STFR comparison between the two studies. The orange and brown lines represent the best fit lines for our and Übler et al. (2017) work respectively. Right Panels: BTFR comparison between the two studies. The purple and brown lines represent the best fit lines for our and Übler et al. (2017) work respectively.
, whereas in the bottom panels, we analyze the full KMOS3D sample studied in GS23 for Vrot/σ > 1. Left Panels: STFR comparison between the two studies. The orange and brown lines represent the best fit lines for our and Übler et al. (2017) work respectively. Right Panels: BTFR comparison between the two studies. The purple and brown lines represent the best fit lines for our and Übler et al. (2017) work respectively.
Current usage metrics show cumulative count of Article Views (full-text article views including HTML views, PDF and ePub downloads, according to the available data) and Abstracts Views on Vision4Press platform.
Data correspond to usage on the plateform after 2015. The current usage metrics is available 48-96 hours after online publication and is updated daily on week days.
Initial download of the metrics may take a while.