Fig. A.1.
Download original image
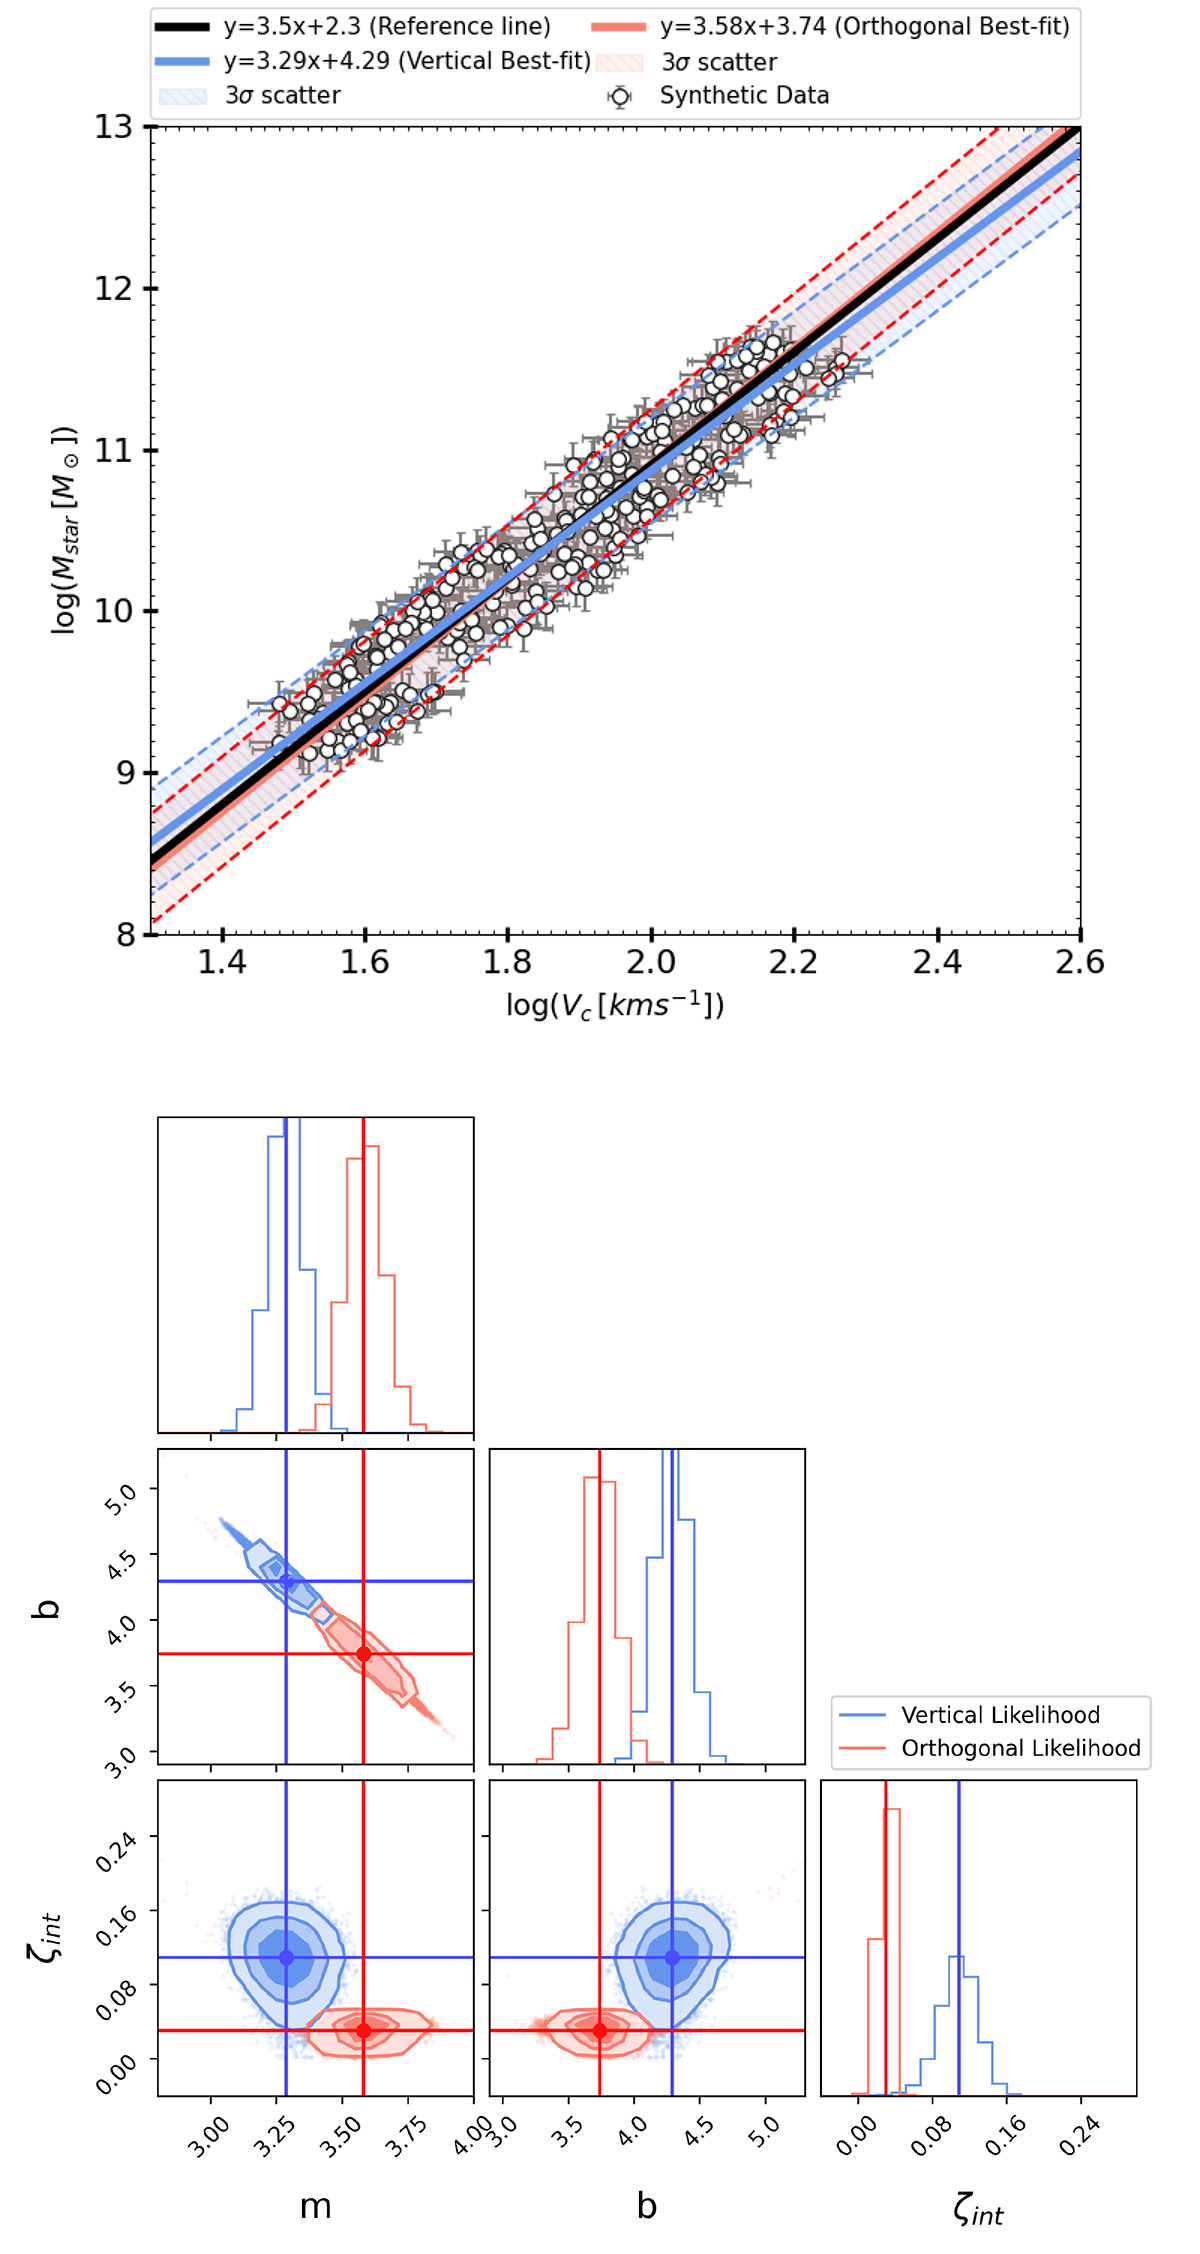
Vertical and orthogonal likelihood fitting on mock data resembling the local stellar and baryonic Tully-Fisher datasets. Upper Panel: Mock dataset depicted as open black circles with errors, accompanied by the best-fit lines. The solid black line represents the true slope of 3.5 used for generating the mock data. The blue and red solid lines correspond to the best fits obtained using the vertical and orthogonal likelihood methods, respectively. Both best-fit lines are followed by 3σ intrinsic scatter regions, indicated with the same color code as the best fits. Lower Panel: Posterior distributions resulting from MCMC-fitting for the vertical and orthogonal likelihoods are shown in blue and red, respectively. The contours within these corner plots illustrates the 68%, 90%, and 99% credible intervals.
Current usage metrics show cumulative count of Article Views (full-text article views including HTML views, PDF and ePub downloads, according to the available data) and Abstracts Views on Vision4Press platform.
Data correspond to usage on the plateform after 2015. The current usage metrics is available 48-96 hours after online publication and is updated daily on week days.
Initial download of the metrics may take a while.