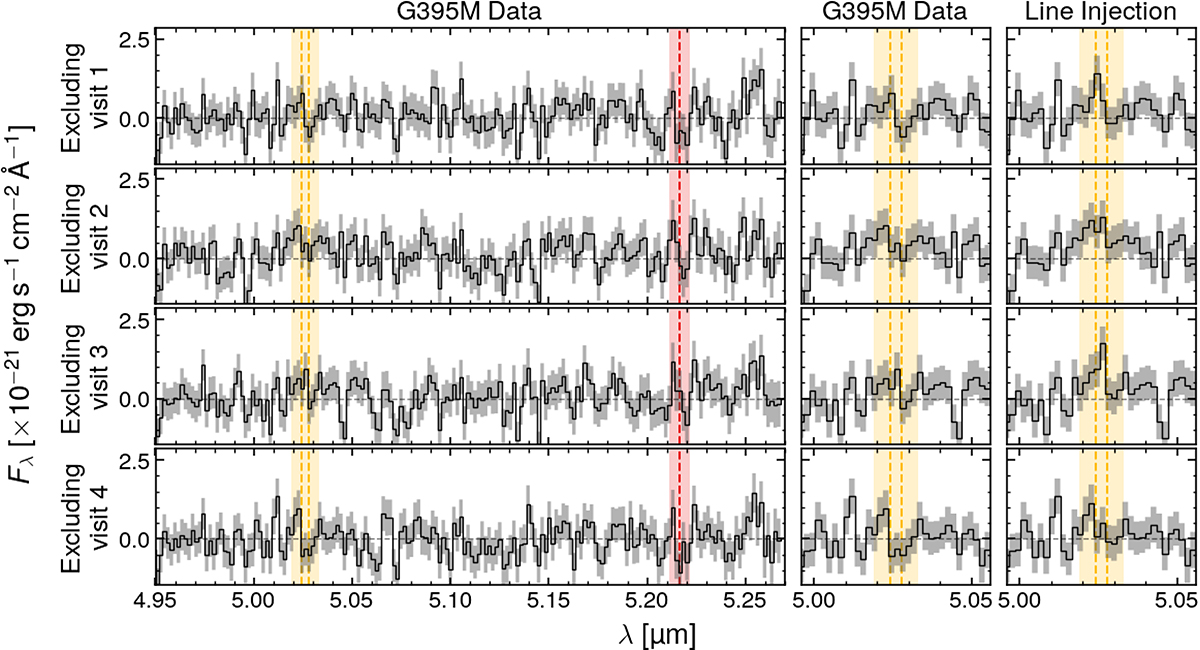
Fig. A.3.
Download original image
Jackknife combination of the G395M grating data; each row is obtained by excluding all the integrations from one of the four visits in PID 3215 and combining the rest (see Table 1). The first column displays the spectral region of interest, the second column is a zoom-in on the region of [O II], the third column is the same as the second, but we added a Gaussian emission line with total flux equal to the [O II] flux measured in the prism. The vertical dashed lines and shaded regions are the same as in Figs. 1 and A.1 and highlight the expected wavelengths of [O II] (orange) and [Ne III] (red). Given the noise of these observations, this line is unlikely to arise from detector artefacts (which may be present in all the integrations from the same visit). The different S/N compared to the fiducial fits are due to the different model adopted here (see text for more details).
Current usage metrics show cumulative count of Article Views (full-text article views including HTML views, PDF and ePub downloads, according to the available data) and Abstracts Views on Vision4Press platform.
Data correspond to usage on the plateform after 2015. The current usage metrics is available 48-96 hours after online publication and is updated daily on week days.
Initial download of the metrics may take a while.