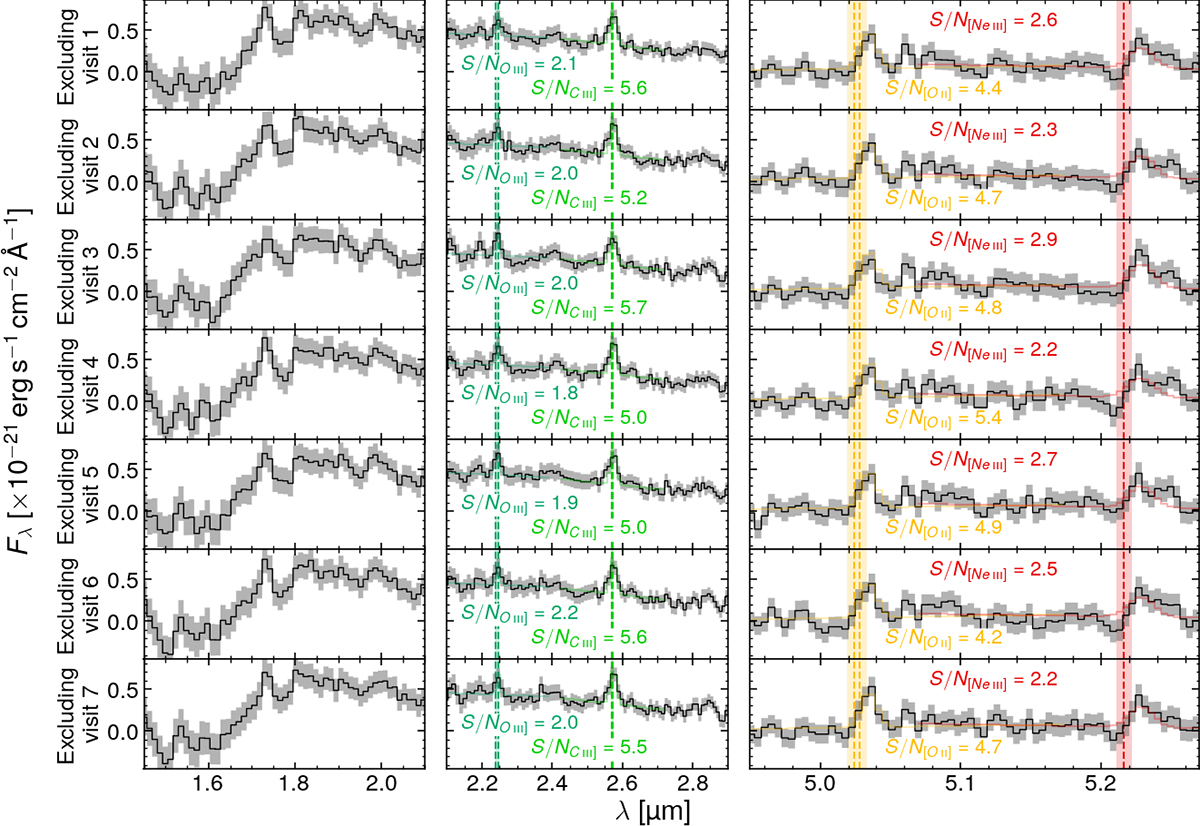
Fig. A.2.
Download original image
Jackknife combination of the prism data; each row is obtained by excluding all the integrations from one of the seven visits and combining the rest. The first two rows exclude the first and second visit from PID 1210; the bottom five rows each exclude one of the visits from PID 3215. The vertical dashed lines and shaded regions are the same as in Figs. 1 and A.1. The labels report the S/N of each line. C III] appears well detected in all combinations, meaning that this line is unlikely to arise from detector artefacts (which may be present in all the integrations from the same visit). The different S/N compared to the fiducial fits are due to the different model adopted here (see text for more details).
Current usage metrics show cumulative count of Article Views (full-text article views including HTML views, PDF and ePub downloads, according to the available data) and Abstracts Views on Vision4Press platform.
Data correspond to usage on the plateform after 2015. The current usage metrics is available 48-96 hours after online publication and is updated daily on week days.
Initial download of the metrics may take a while.