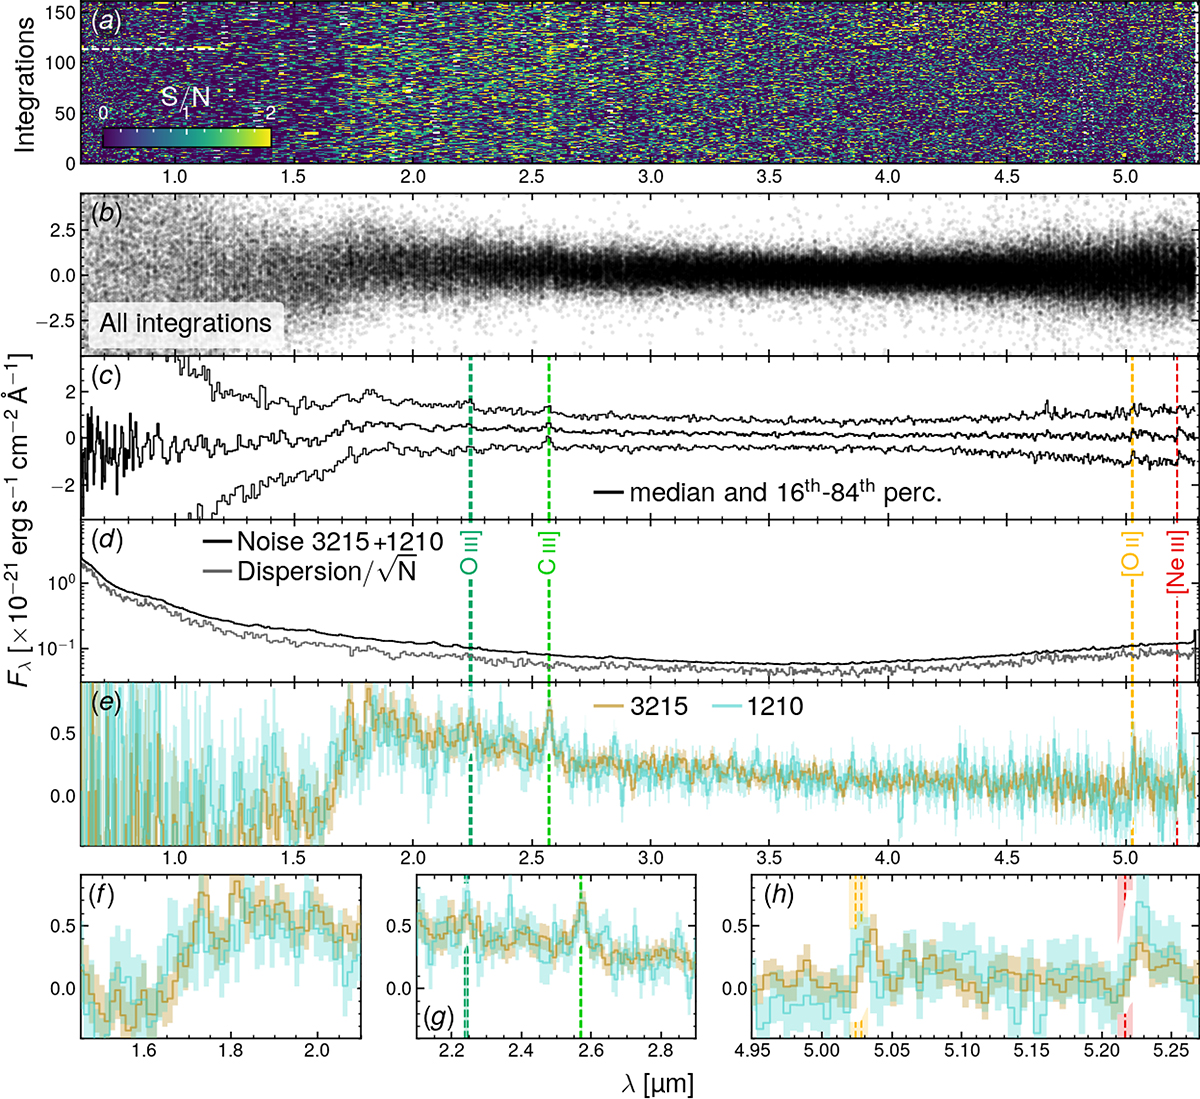
Fig. A.1.
Download original image
Summary of the prism observations. Panel a; S/N of each of the 162 individual integrations. The horizontal dashed line separates the bottom 114 rows with the 3215 integrations from the 1210 integrations above. Panel b; spectrum of each of the individual integrations. A feature at the location of C III] is clearly seen. Panel c; median and 16th–84th percentile of panel b, showing again the presence of C III], and the possible presence of [O II]. Panel d; comparison between the noise estimated by the data reduction pipeline (black) with the noise estimated from the dispersion of the integrations (grey, calculated under a Gaussian-noise assumption). Panels e–h; comparison between 3215 (sand) and 1210 (cyan), showing that C III] is seen in both programmes; in contrast, O III] is not seen in 3215 (the deepest of the two surveys); an emission line close to the position of [O II] is seen in both surveys, but at different wavelengths; [Ne III] is seen in 3215, but has an unconvincing line profile in 1210.
Current usage metrics show cumulative count of Article Views (full-text article views including HTML views, PDF and ePub downloads, according to the available data) and Abstracts Views on Vision4Press platform.
Data correspond to usage on the plateform after 2015. The current usage metrics is available 48-96 hours after online publication and is updated daily on week days.
Initial download of the metrics may take a while.