Fig. 6.
Download original image
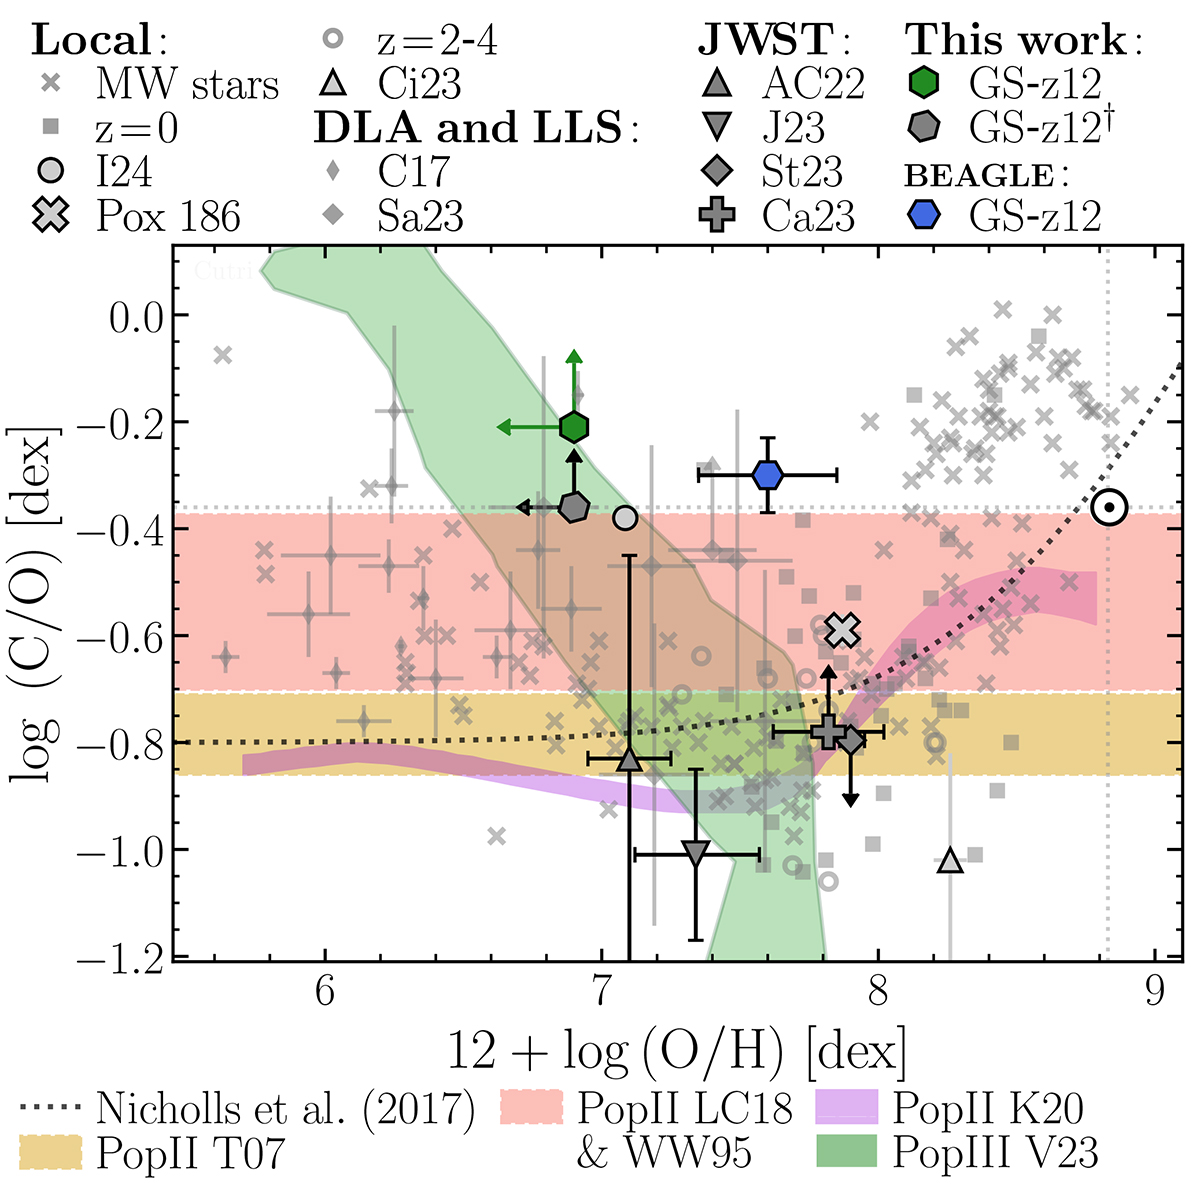
Compilation of chemical abundance patterns from both local stars and galaxies (see text for references) and from metal-poor galaxies at z = 2 − 9, compared to the yields of PopII and PopIII supernovae. The grey dotted lines are the solar abundances (G16). Regardless of the precise assumptions used, GS-z12 (hexagons) stands out as a metal-poor system with high C/O abundance, and is therefore closer to DLA systems (Cooke et al. 2017, C17; Saccardi et al. 2023, Sa23) than to other high-redshift galaxies recently observed by JWST (Arellano-Córdova et al. 2022, AC22; Jones et al. 2023, J23; Cameron et al. 2023b, Ca23; Stiavelli et al. 2023, St23). The dotted line is the chemical enrichment pattern from Nicholls et al. (2017); the golden horizontal hatched band is the yield of PopII supernovae from Tominaga et al. (2007). The purple region is the PopII abundance pattern from Kobayashi et al. (2020). The red horizontal band is the combined yield of metal-poor Type II supernovae from Woosley & Weaver (1995) and Limongi & Chieffi (2018). The green region is the yield of PopIII supernovae (Heger & Woosley 2010, adapted from Vanni et al. 2023). We adopt the solar abundance ratio log(C/O) = − 0.36 (G16).
Current usage metrics show cumulative count of Article Views (full-text article views including HTML views, PDF and ePub downloads, according to the available data) and Abstracts Views on Vision4Press platform.
Data correspond to usage on the plateform after 2015. The current usage metrics is available 48-96 hours after online publication and is updated daily on week days.
Initial download of the metrics may take a while.