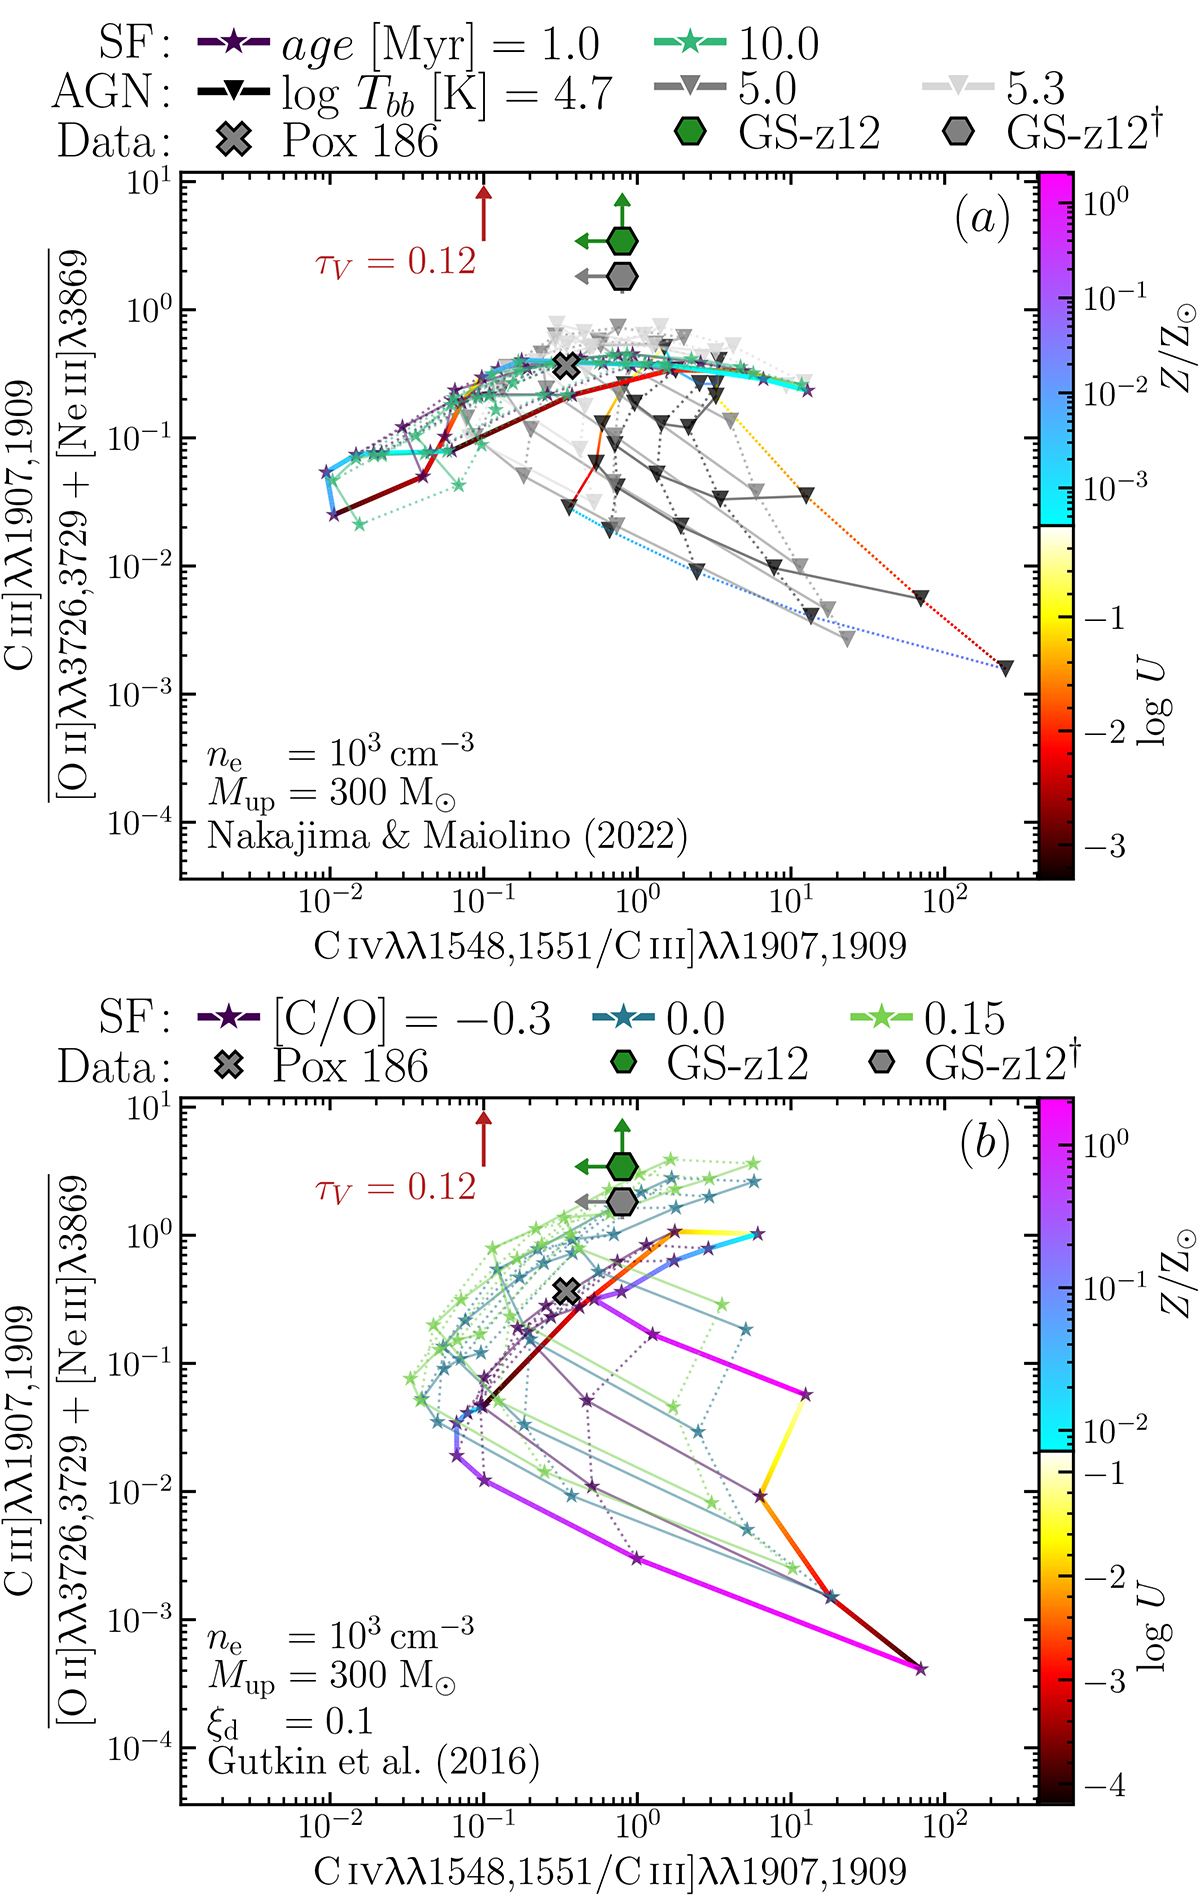
Fig. 5.
Download original image
Abundance diagnostic diagrams. Panel a; our upper limits on GS-z12 (hexagon), compared to photoionisation models powered by star formation (SF; stars) and AGN (triangles; NM22), illustrating that GS-z12 lies well outside the range of grids with solar and subsolar C/O (used by NM22). Panel b; star-forming models of G16, with varying C/O abundance between 0.5 and 1.4 solar. Combining the detection of C III]λ1909 with stringent upper limits on [O II]λλ3726,3729 and [Ne III]λ3869, the models constrain the abundance to super-solar values, i.e. much higher values than what is observed in galaxies at z = 9 (see Fig. 6) and in the local analogue Pox 186 (Kumari et al. 2024). Alternatively, assuming both [O II] and [Ne III] to be detected, we obtain the grey hexagon marked with a †, which points to a solar [C/O] – still high for high-redshift galaxies. The red upward arrow marks the magnitude of the dust reddening correction, which we conservatively do not apply. We colour code only the external lines in the grids, and only for one of the SF and AGN grids; note the different range of the grid parameters.
Current usage metrics show cumulative count of Article Views (full-text article views including HTML views, PDF and ePub downloads, according to the available data) and Abstracts Views on Vision4Press platform.
Data correspond to usage on the plateform after 2015. The current usage metrics is available 48-96 hours after online publication and is updated daily on week days.
Initial download of the metrics may take a while.