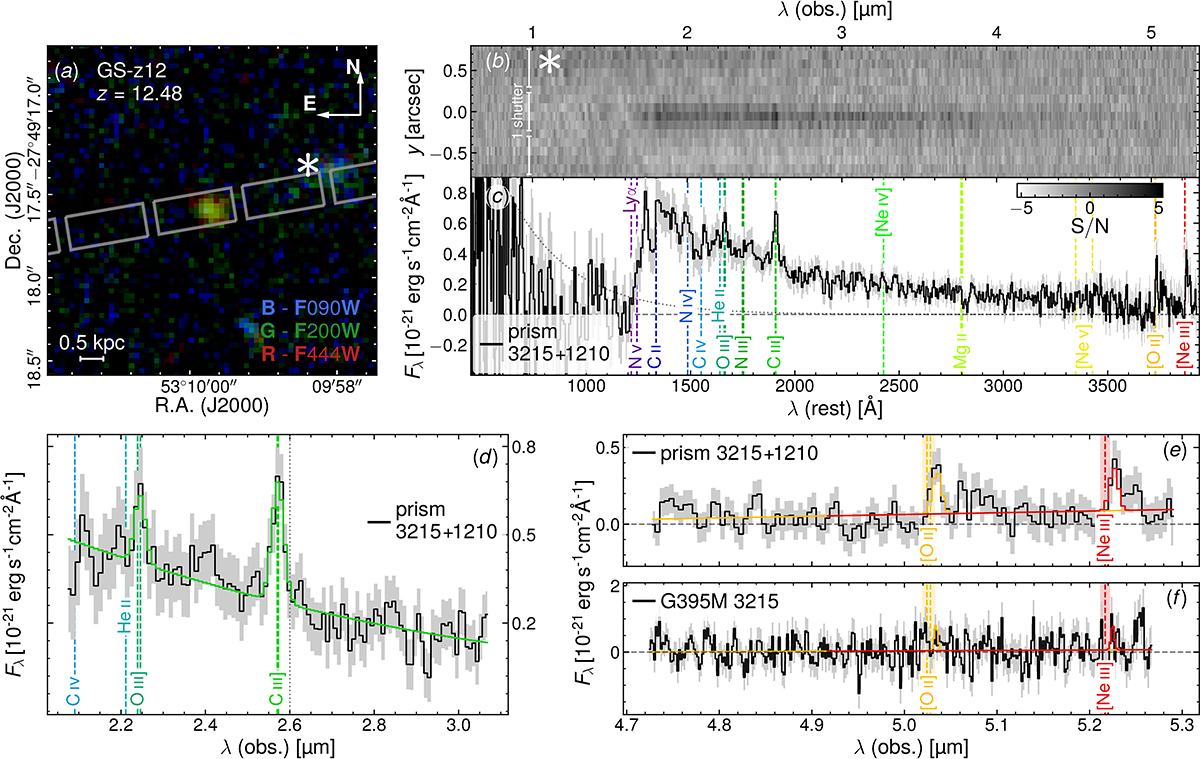
Fig. 1.
Download original image
Summary of our observations. Panel a; false-colour RGB image, highlighting the position of the NIRSpec/MSA shutters in PID 3215. The asterisk indicates the position of an interloper with low surface brightness, which was removed in the data reduction. Panel b; 2-d S/N map, showing the three central shutters (the asterisk is the position of the interloper). Panel c; 1-d boxcar-extracted prism spectrum, combining 3215 and 1210; the vertical dashed lines marking the position of strong emission lines at z = 12.48. Panels d–f; combined 3215 and 1210 data and model spectrum around the O III], C III], [O II] and [Ne III] lines, for the prism (panels d and e) and for the G395M grating (only 3215; panel f). C III] is detected at the 5-σ level (7-σ with the bootstrapping method). O III] is not robustly detected (2.3-σ significance); [O II] and [Ne III] are marginally detected only in the prism (4- and 3.5-σ) but not in the grating, despite comparable sensitivity. The vertical dashed lines mark the wavelength of the emission lines at the redshift of the object, with the shaded region indicating the redshift uncertainty.
Current usage metrics show cumulative count of Article Views (full-text article views including HTML views, PDF and ePub downloads, according to the available data) and Abstracts Views on Vision4Press platform.
Data correspond to usage on the plateform after 2015. The current usage metrics is available 48-96 hours after online publication and is updated daily on week days.
Initial download of the metrics may take a while.