Fig. 9.
Download original image
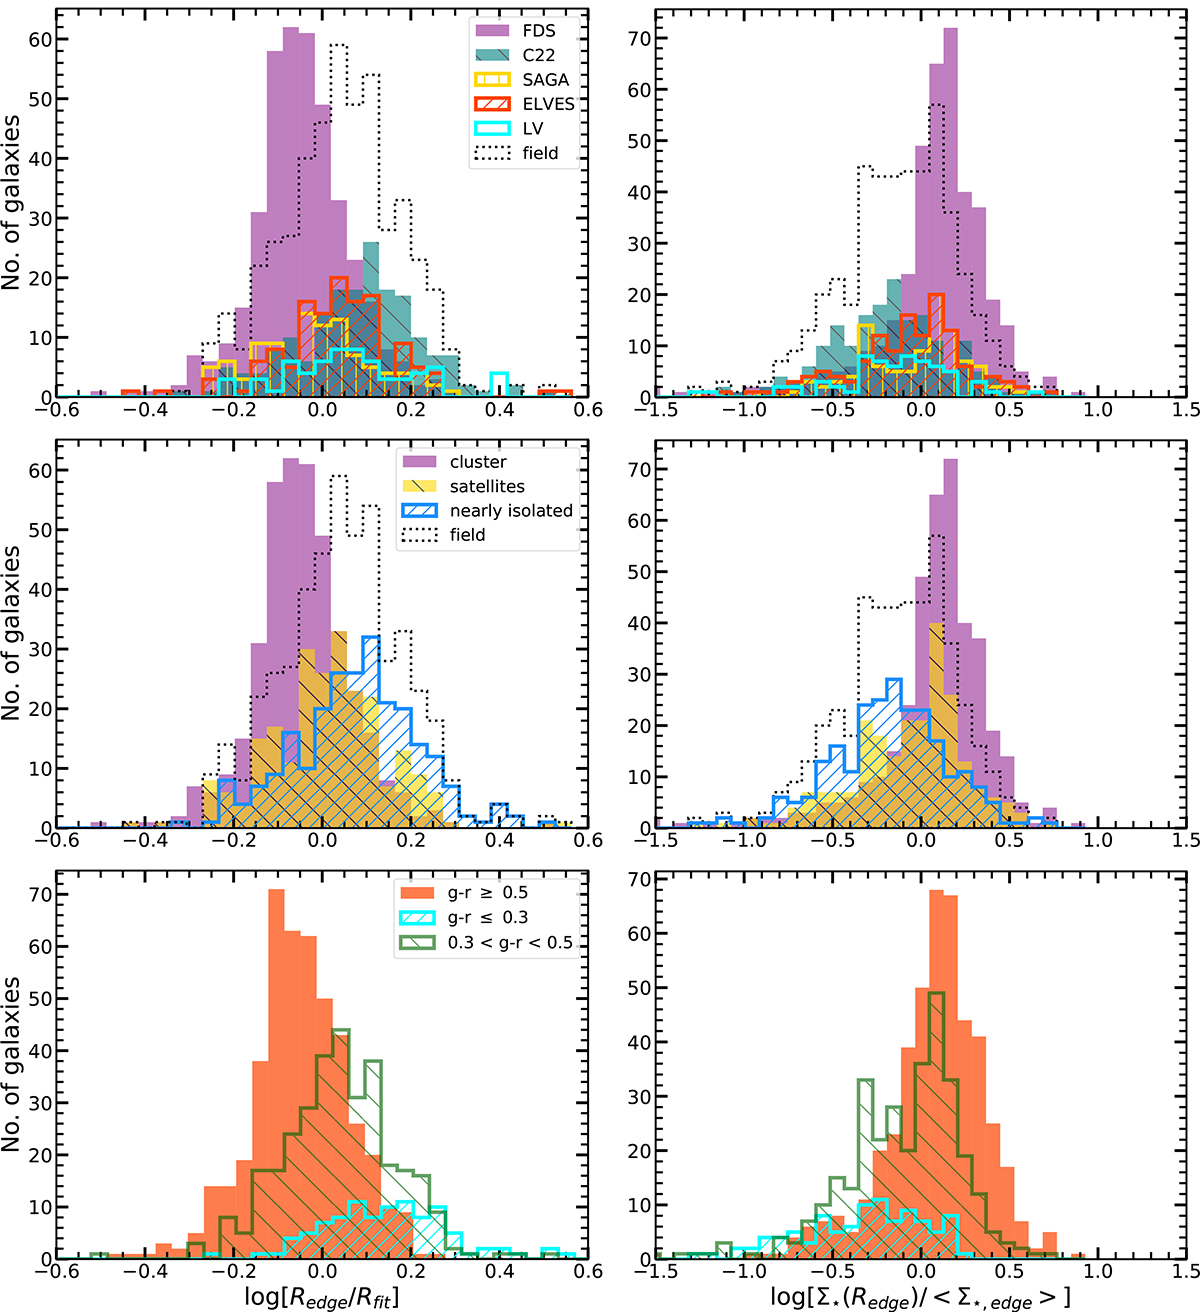
Distribution of edge radii (left) and surface stellar mass densities (right) normalised by the expected value derived from the regression of these measurements against stellar mass (![]() and ⟨Σ⋆, edge⟩ from Chamba et al. (2022), respectively; see Fig. 8). In the upper and middle panels, Fornax dwarf galaxies are shown in purple. The individual samples considered are separated by the labelled designs (upper). The distribution of the rest of the sample (field + satellites combined) is plotted in black dotted lines. In the middle panel, we combine the field (Chamba et al. 2022 and Karachentsev et al. 2013 in blue) and satellite (SAGA; Mao et al. 2021 and ELVES; Carlsten et al. 2022 in yellow) samples to further visualise the distinction between their distributions. The lower panels show the distribution of galaxies in the size– and edge density–stellar mass planes when separated in three bins of g − r colour, showing that redder, older galaxies populate the lower half of the size–mass relation (left) and upper half in the density-stellar mass relation (right). Quantitatively, the panels show that compared to field galaxies, Fornax cluster galaxies can be up to 50% smaller and on average, redder, older and two times denser at the edge.
and ⟨Σ⋆, edge⟩ from Chamba et al. (2022), respectively; see Fig. 8). In the upper and middle panels, Fornax dwarf galaxies are shown in purple. The individual samples considered are separated by the labelled designs (upper). The distribution of the rest of the sample (field + satellites combined) is plotted in black dotted lines. In the middle panel, we combine the field (Chamba et al. 2022 and Karachentsev et al. 2013 in blue) and satellite (SAGA; Mao et al. 2021 and ELVES; Carlsten et al. 2022 in yellow) samples to further visualise the distinction between their distributions. The lower panels show the distribution of galaxies in the size– and edge density–stellar mass planes when separated in three bins of g − r colour, showing that redder, older galaxies populate the lower half of the size–mass relation (left) and upper half in the density-stellar mass relation (right). Quantitatively, the panels show that compared to field galaxies, Fornax cluster galaxies can be up to 50% smaller and on average, redder, older and two times denser at the edge.
Current usage metrics show cumulative count of Article Views (full-text article views including HTML views, PDF and ePub downloads, according to the available data) and Abstracts Views on Vision4Press platform.
Data correspond to usage on the plateform after 2015. The current usage metrics is available 48-96 hours after online publication and is updated daily on week days.
Initial download of the metrics may take a while.