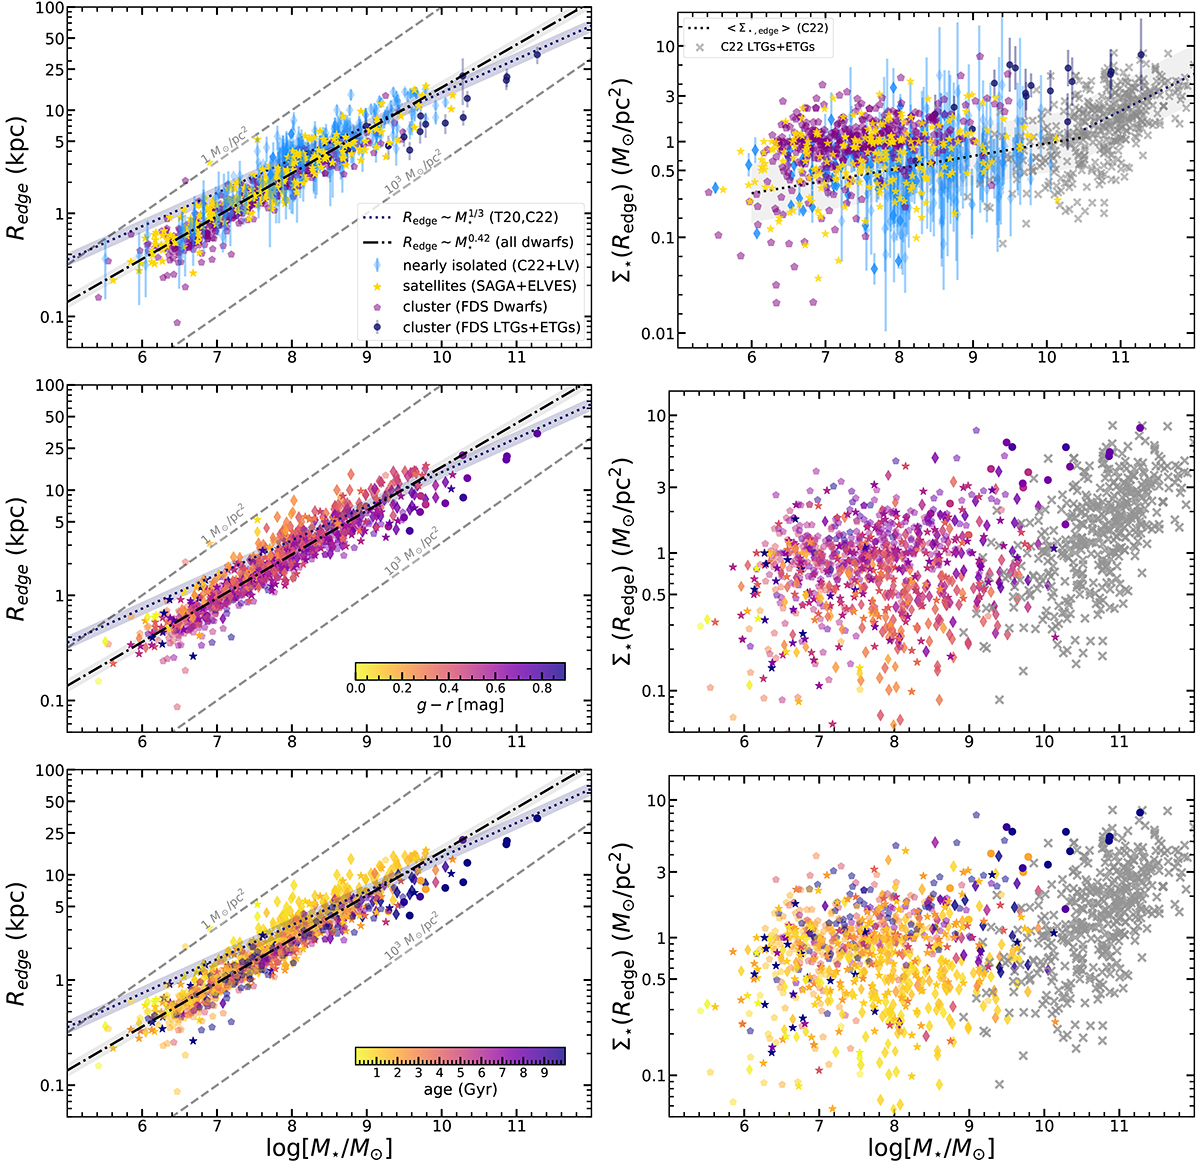
Fig. 8.
Download original image
Size–stellar mass relation using edge radii (left) and the associated edge density–stellar mass relation (right). For visualisation reasons, we only plot the combined uncertainties due to the background and stellar mass estimation in our measurements (see text for details) for the field and Fornax LTGs/ETGs samples in the upper panels to demonstrate the typical values across the full stellar mass range of the scaling relations. Upper: Best-fit laws fitting the labelled dwarf samples: ![]() (reported for galaxies with M⋆ > 107 M⊙ in Trujillo et al. 2020; Chamba et al. 2022) and
(reported for galaxies with M⋆ > 107 M⊙ in Trujillo et al. 2020; Chamba et al. 2022) and ![]() (this work). We plot the Fornax cluster dwarfs (purple pentagons), SAGA (Mao et al. 2021) and ELVES (Carlsten et al. 2022) satellites (yellow stars) and sub-sample Chamba et al. (2022) and Karachentsev et al. (2013) field galaxies (blue diamonds). For completeness, the radii for Fornax cluster massive late-type and early-type galaxies (black circles) are also shown. The shaded regions show the intrinsic scatter of each relation (∼0.06 dex for edge radii). At a fixed stellar mass, the majority of Fornax galaxies are below the best-fit line. The edge density-stellar mass plane is plotted using the same symbols and colours as in the left panels. The piecewise, Σ⋆, edge best-fit relations as well as the luminous ETGs and LTGs from Chamba et al. (2022) (grey crosses) are shown for reference. Middle: The same relations are now colour coded according to the global g − r colour of the galaxy. The symbols representing each sub-sample are those used in the upper panels. Lower: Similar to the middle panels, but now using the g − r colour to estimate the age of the galaxy from MILES (Vazdekis et al. 2012) for a fixed metallicity of [M/H] = –0.71 (see text for details). For reference, the age of the dwarf elliptical galaxies with M⋆ > 107 M⊙ in the Fornax Cluster is ∼10 Gyr (Rakos et al. 2001). The figure shows that galaxy edges in the Fornax cluster are smaller, denser and redder compared to the satellite and field samples. We use the best-fit relations to quantify and represent these results as histograms in Fig. 9.
(this work). We plot the Fornax cluster dwarfs (purple pentagons), SAGA (Mao et al. 2021) and ELVES (Carlsten et al. 2022) satellites (yellow stars) and sub-sample Chamba et al. (2022) and Karachentsev et al. (2013) field galaxies (blue diamonds). For completeness, the radii for Fornax cluster massive late-type and early-type galaxies (black circles) are also shown. The shaded regions show the intrinsic scatter of each relation (∼0.06 dex for edge radii). At a fixed stellar mass, the majority of Fornax galaxies are below the best-fit line. The edge density-stellar mass plane is plotted using the same symbols and colours as in the left panels. The piecewise, Σ⋆, edge best-fit relations as well as the luminous ETGs and LTGs from Chamba et al. (2022) (grey crosses) are shown for reference. Middle: The same relations are now colour coded according to the global g − r colour of the galaxy. The symbols representing each sub-sample are those used in the upper panels. Lower: Similar to the middle panels, but now using the g − r colour to estimate the age of the galaxy from MILES (Vazdekis et al. 2012) for a fixed metallicity of [M/H] = –0.71 (see text for details). For reference, the age of the dwarf elliptical galaxies with M⋆ > 107 M⊙ in the Fornax Cluster is ∼10 Gyr (Rakos et al. 2001). The figure shows that galaxy edges in the Fornax cluster are smaller, denser and redder compared to the satellite and field samples. We use the best-fit relations to quantify and represent these results as histograms in Fig. 9.
Current usage metrics show cumulative count of Article Views (full-text article views including HTML views, PDF and ePub downloads, according to the available data) and Abstracts Views on Vision4Press platform.
Data correspond to usage on the plateform after 2015. The current usage metrics is available 48-96 hours after online publication and is updated daily on week days.
Initial download of the metrics may take a while.