Fig. 6.
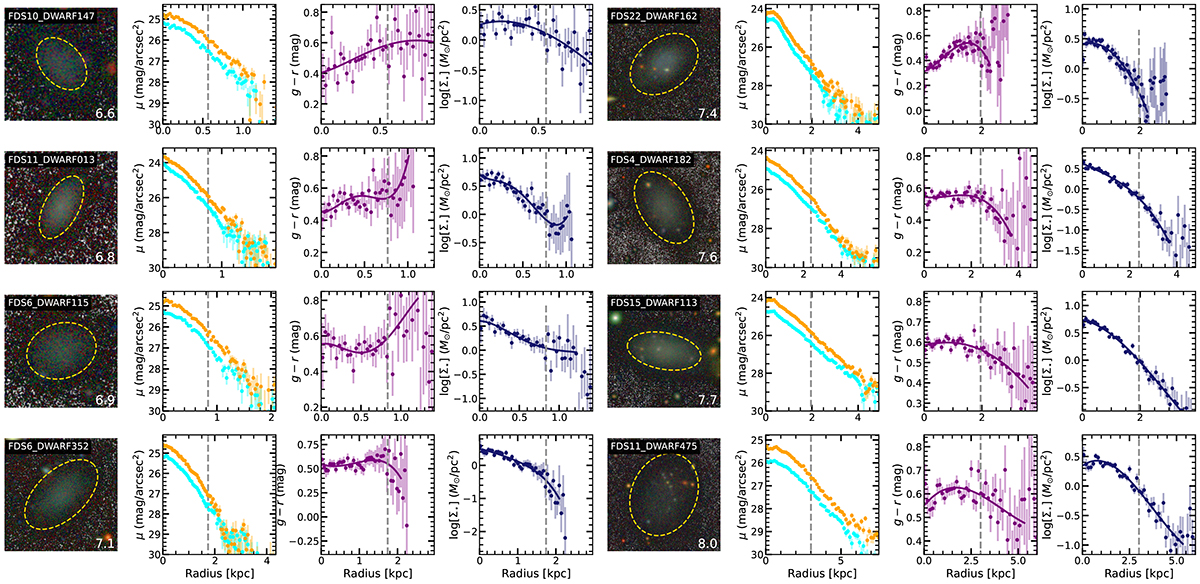
Download original image
Similar to Fig. 2: example radial profiles of cluster dwarf galaxies with M⋆ ≲ 108 M⊙. The first panel is the gri-colour composite image using FDS images (Venhola et al. 2018), overlaid on a grey scale background to highlight the low surface brightness boundaries of these galaxies. White in this scale indicates non-detections or background pixels in the data. FDS names for each galaxy from Venhola et al. (2018), Su et al. (2021), the estimated stellar mass in units of log M⋆/M⊙ (left) and edge locations (dashed ellipses) are indicated in each panel. The second, third and fourth panels are the g (cyan) and r-band (orange) surface brightness, g − r and Σ⋆ profiles respectively. The identified edge feature is indicated as a vertical dashed line. To highlight the inflection point we mark as the edge feature in the colour and stellar surface density profiles, we additional plot a least squares polynomial fit of degree four as a solid line in those panels. Galaxies are ordered by increasing stellar mass from the upper to lower panels.
Current usage metrics show cumulative count of Article Views (full-text article views including HTML views, PDF and ePub downloads, according to the available data) and Abstracts Views on Vision4Press platform.
Data correspond to usage on the plateform after 2015. The current usage metrics is available 48-96 hours after online publication and is updated daily on week days.
Initial download of the metrics may take a while.