Fig. 4.
Download original image
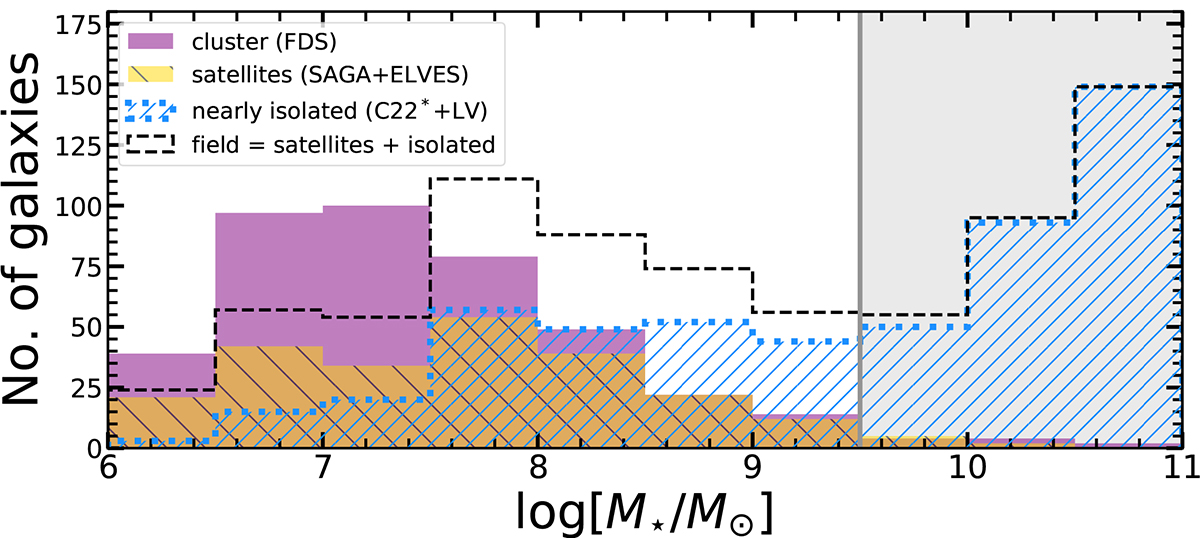
Distribution of the number of galaxies in stellar mass bins of width 0.5 dex in our final Fornax cluster (purple), satellite (yellow, right hatched), and nearly isolated (blue, dotted and left hatched) samples. The field sample combining the satellites and isolated galaxies are plotted in dashed black lines. C22* in this figure indicates that we have included the Chamba et al. (2022) LTG and ETG sample here only to show the lack of cluster galaxies beyond M⋆ > 109.5 M⊙ (grey region).
Current usage metrics show cumulative count of Article Views (full-text article views including HTML views, PDF and ePub downloads, according to the available data) and Abstracts Views on Vision4Press platform.
Data correspond to usage on the plateform after 2015. The current usage metrics is available 48-96 hours after online publication and is updated daily on week days.
Initial download of the metrics may take a while.