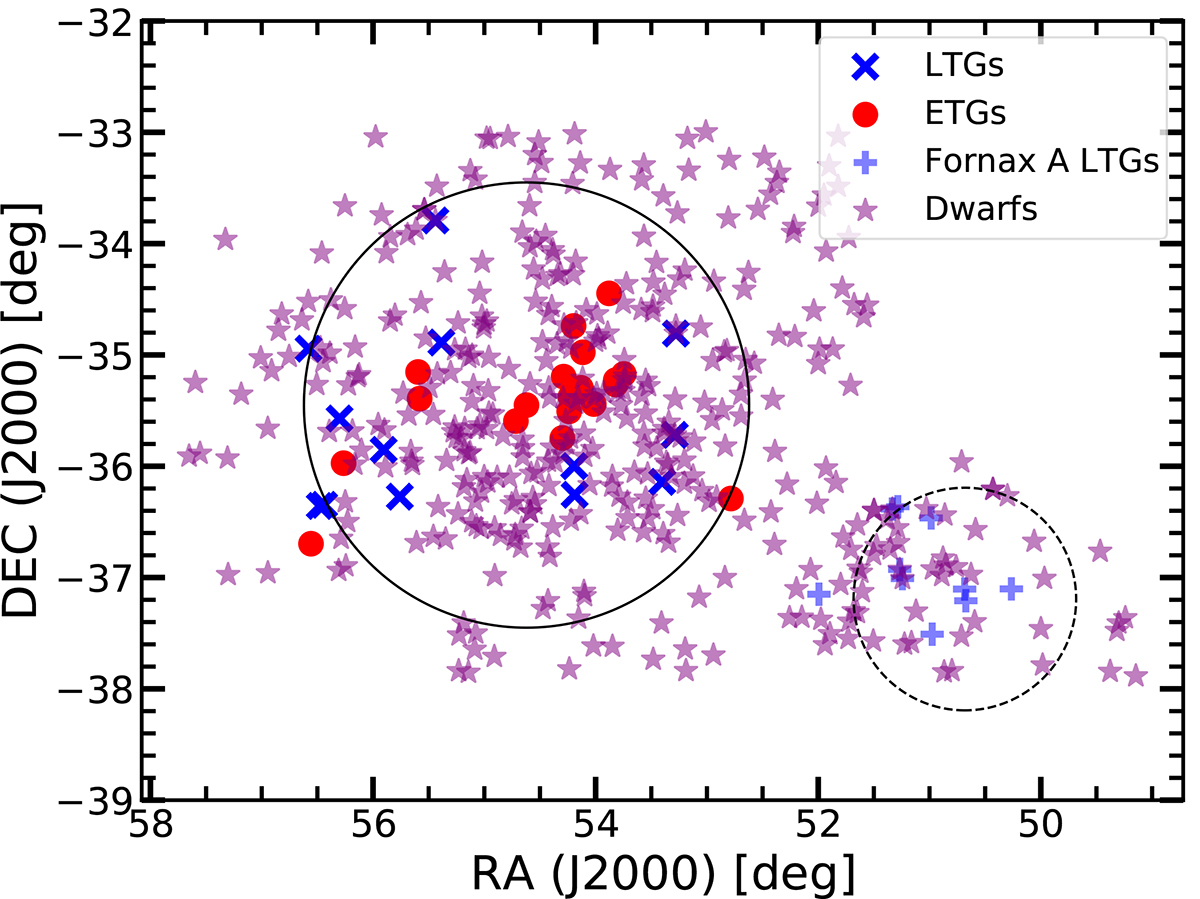
Fig. 3.
Download original image
Schematic of the Fornax Cluster and Fornax A sub-group from the Fornax Deep Survey. The positions of dwarfs (purple stars), late-type and early-type galaxies (blue crosses and red dots, respectively) catalogued by Venhola et al. (2018) are plotted. The virial radius of the cluster (black circle with radius ∼2 deg) and Fornax A sub-group (black, dashed circle with radius ∼1 deg). The late-type galaxies in the subgroup are plotted as blue pluses for distinction.
Current usage metrics show cumulative count of Article Views (full-text article views including HTML views, PDF and ePub downloads, according to the available data) and Abstracts Views on Vision4Press platform.
Data correspond to usage on the plateform after 2015. The current usage metrics is available 48-96 hours after online publication and is updated daily on week days.
Initial download of the metrics may take a while.