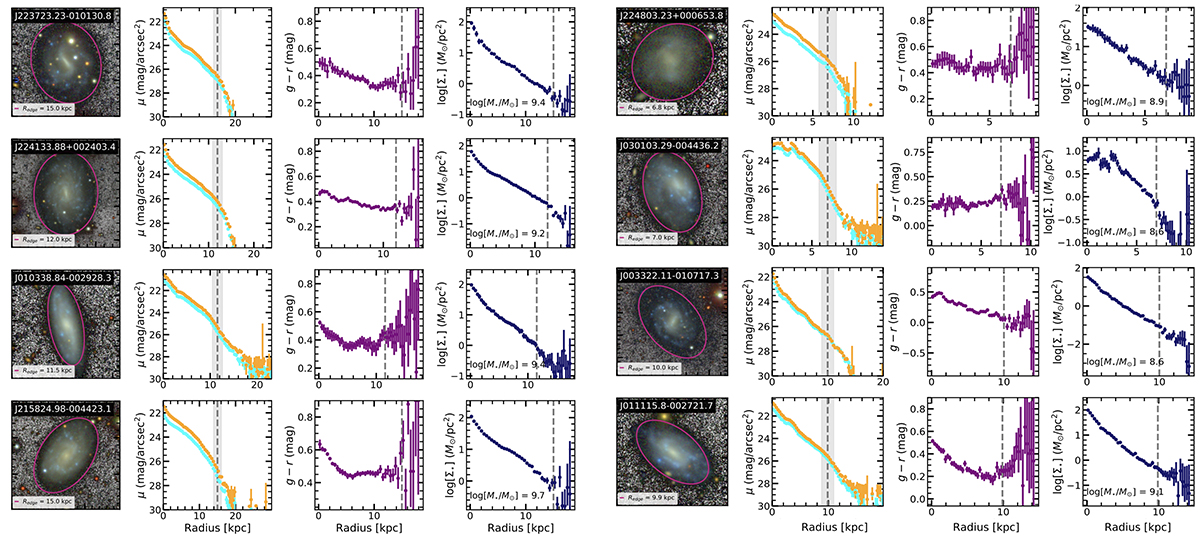
Fig. 2.
Download original image
Radial profiles of galaxies with stellar masses ∼109 M⊙ from the Chamba et al. (2022) field sample. Left to right: RGB composite image from IAC Stripe 82 with a grey background to highlight the low surface brightness edge location (pink ellipse). Surface brightness profiles in r-band (orange) and g-band (cyan), g − r colour and surface stellar mass density profiles. The location of the detected edges are shown as vertical dashed lines and the shaded grey areas are the typical uncertainties associated with repeated measurements by Chamba et al. (2022) (∼0.04 dex).
Current usage metrics show cumulative count of Article Views (full-text article views including HTML views, PDF and ePub downloads, according to the available data) and Abstracts Views on Vision4Press platform.
Data correspond to usage on the plateform after 2015. The current usage metrics is available 48-96 hours after online publication and is updated daily on week days.
Initial download of the metrics may take a while.