Fig. 16.
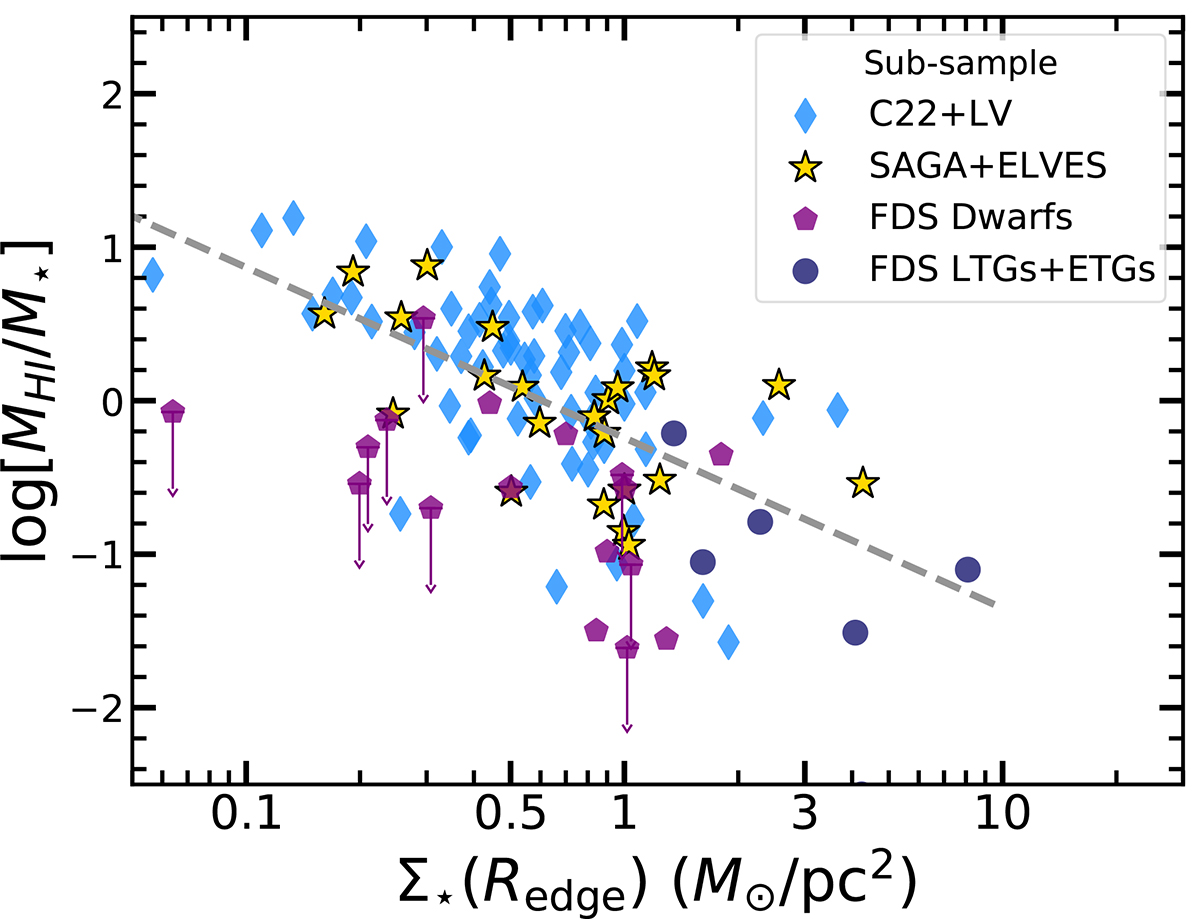
Download original image
Ratio of HI-to-stellar masses of a sub-sample of local volume field galaxies (blue diamonds; 64 studied here out of the 96 with available DeCaLs imaging from Karachentsev et al. 2013); nine SAGA and 15 ELVES satellites (yellow stars; matched with the Durbala et al. (2020) and Zhu & Putman (2023) measurements, respectively); and the Fornax galaxies (purple pentagons; 17 studied here out of the 39 HI masses or upper limits reported in Kleiner et al. 2023) as a function of edge surface stellar mass density. The HI masses of the Fornax LTGs and ETGs are taken from Loni et al. (2021) when available (dark blue points). Higher edge densities are found when the H I-to-stellar masses ratios are lower. A best-fit to the data points is shown as a dashed line to highlight this trend.
Current usage metrics show cumulative count of Article Views (full-text article views including HTML views, PDF and ePub downloads, according to the available data) and Abstracts Views on Vision4Press platform.
Data correspond to usage on the plateform after 2015. The current usage metrics is available 48-96 hours after online publication and is updated daily on week days.
Initial download of the metrics may take a while.