Fig. 15.
Download original image
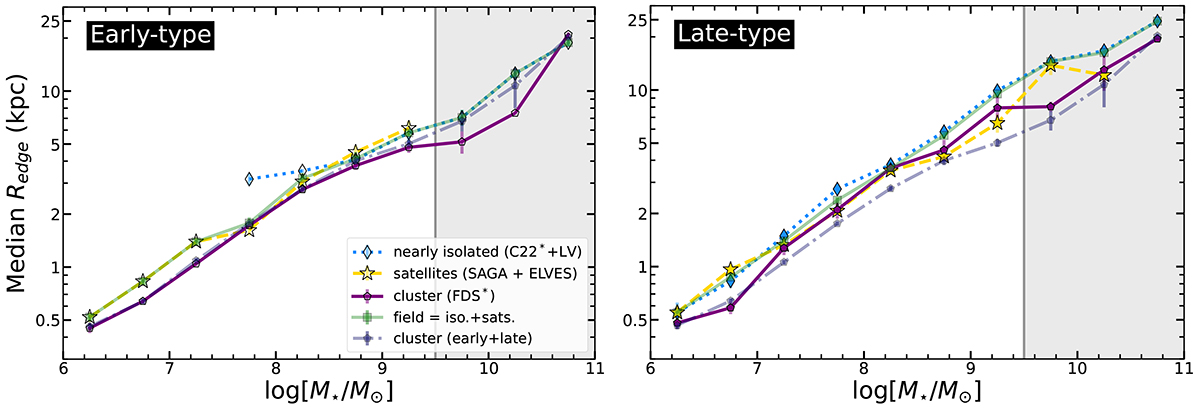
Similar to Fig. 13 but now separated by morphology and environment. The early-type galaxies are plotted on the left and late-type ones on the right. In both panels we plot those galaxies in the field by combining the nearly isolated and satellite samples (green squares). We also plot the combined line for the cluster using the full sample of early- and late-type galaxies (the same shown in Fig. 13) in the dot-dashed line. Both the early- and late-type galaxies are smaller in the Fornax cluster compared to the field. However, the early-type galaxies are even smaller than the late-type ones, regardless of the environment (Fig. 14).
Current usage metrics show cumulative count of Article Views (full-text article views including HTML views, PDF and ePub downloads, according to the available data) and Abstracts Views on Vision4Press platform.
Data correspond to usage on the plateform after 2015. The current usage metrics is available 48-96 hours after online publication and is updated daily on week days.
Initial download of the metrics may take a while.