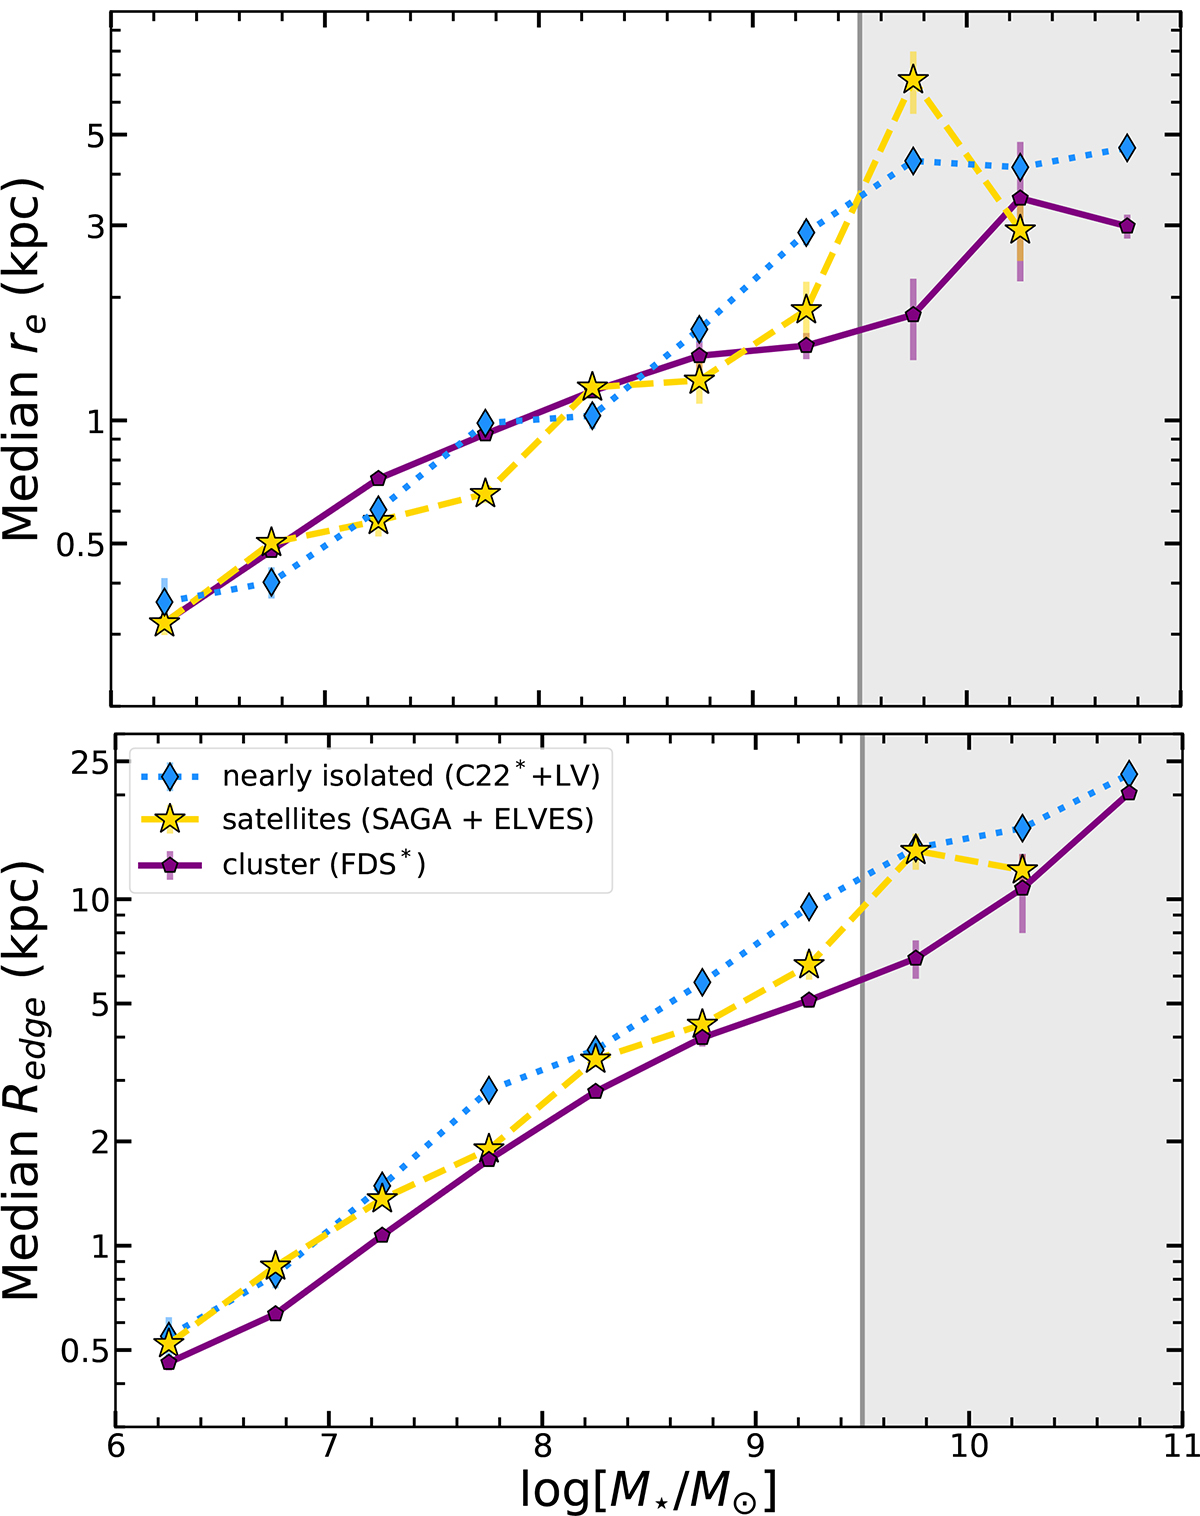
Fig. 13.
Download original image
Median effective (upper) and edge radii (lower) in bins of stellar mass. The distribution of the number of galaxies used to compute the median radii in each stellar mass bin was plotted in Fig. 4. The shaded grey region corresponds to the stellar mass regime beyond which we lack cluster and satellite galaxies for a meaningful, statistical comparison. However, we compute the median points with the few galaxies in our sample for completeness. The separation between the Fornax cluster and field sample is much more clear in median edge radii: the cluster galaxies are systematically smaller in edge radii across the full stellar mass range considered, which is not reflected by the re measurements.
Current usage metrics show cumulative count of Article Views (full-text article views including HTML views, PDF and ePub downloads, according to the available data) and Abstracts Views on Vision4Press platform.
Data correspond to usage on the plateform after 2015. The current usage metrics is available 48-96 hours after online publication and is updated daily on week days.
Initial download of the metrics may take a while.