Fig. 12.
Download original image
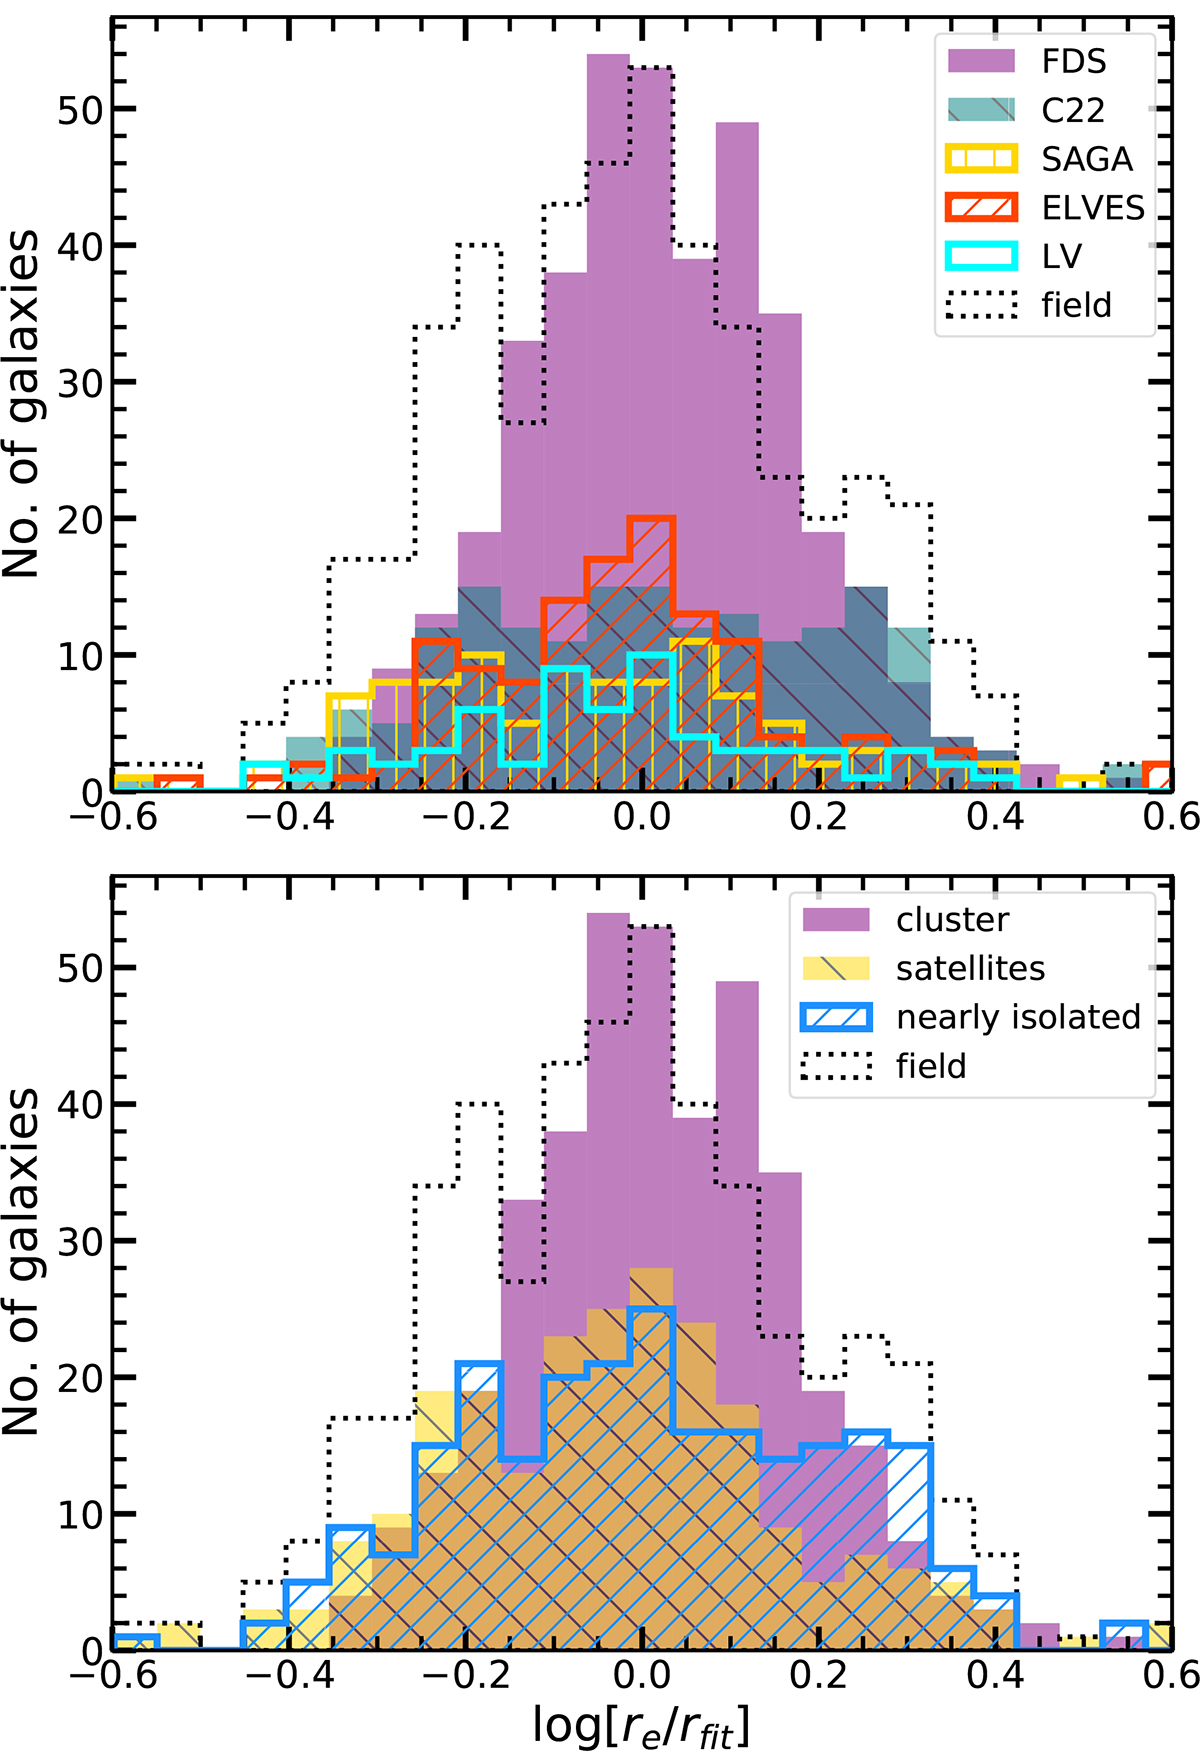
Distribution of half-light radii, normalised by the expected value derived from the regression of re against stellar mass (![]() ; see Fig. 11). As in Fig. 9, Fornax dwarf galaxies are shown in purple. The upper panels shows the distribution of individual samples separated by the labelled designs as in the left of Fig. 9. The lower panel shows the full satellites (yellow) and the combined nearly isolated + satellites samples (blue). The total field sample is plotted in dotted black lines. There is no obvious distinction between the samples in the effective radius–stellar mass plane.
; see Fig. 11). As in Fig. 9, Fornax dwarf galaxies are shown in purple. The upper panels shows the distribution of individual samples separated by the labelled designs as in the left of Fig. 9. The lower panel shows the full satellites (yellow) and the combined nearly isolated + satellites samples (blue). The total field sample is plotted in dotted black lines. There is no obvious distinction between the samples in the effective radius–stellar mass plane.
Current usage metrics show cumulative count of Article Views (full-text article views including HTML views, PDF and ePub downloads, according to the available data) and Abstracts Views on Vision4Press platform.
Data correspond to usage on the plateform after 2015. The current usage metrics is available 48-96 hours after online publication and is updated daily on week days.
Initial download of the metrics may take a while.